Weather Graph Widget: Full Guide to Install Live Weather to Your Site
An interactive weather graph widget is the ultimate tool to transform plain, static forecast text into dynamic visual data, boosting visitor engagement by up to 300%. Implementing the right widget ensures your users get real-time, scannable insights without ever leaving your platform. Let’s dive into the top options and integration steps to elevate your site’s user experience today!
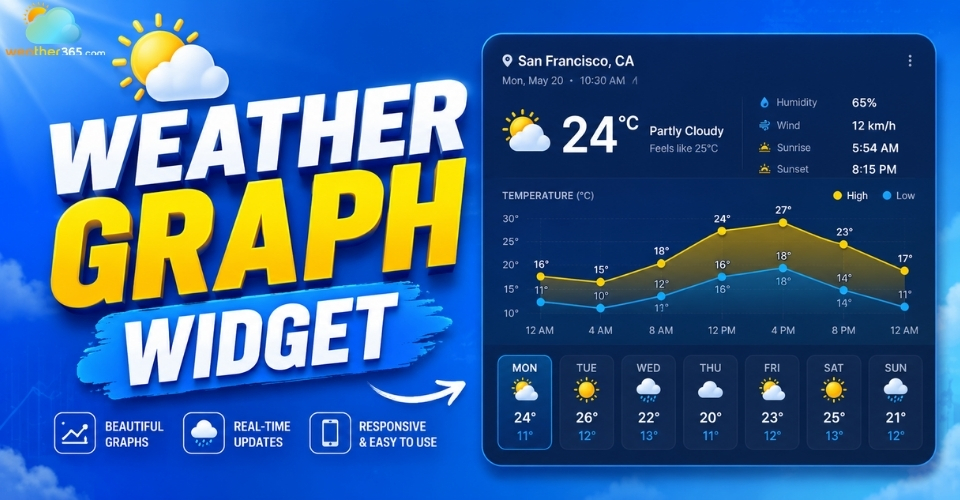
Weather graph widget
What is a Weather Graph Widget?
A weather graph widget is an embedded UI component that translates complex atmospheric data into intuitive, scannable visual charts.
As one of the most practical interactive widgets for modern websites, it utilizes weather chart visualization to display temperature curves, precipitation bars, and pressure trends at a glance
By integrating a live weather tracker directly into your layout, you provide immediate contextual value to your audience.
This is particularly crucial for:
Travel and Tourism Blogs: Helping visitors visually map out afternoon rain windows or optimal travel days.
Local Businesses & Event Planners: Keeping customers informed about outdoor seating availability or venue conditions.
Outdoor Sports Portals: Giving surfers, hikers, or golfers a clear view of hourly wind shear and temperature drops.
Real Estate Listings: Showcasing seasonal climate trends for prospective neighborhood buyers.
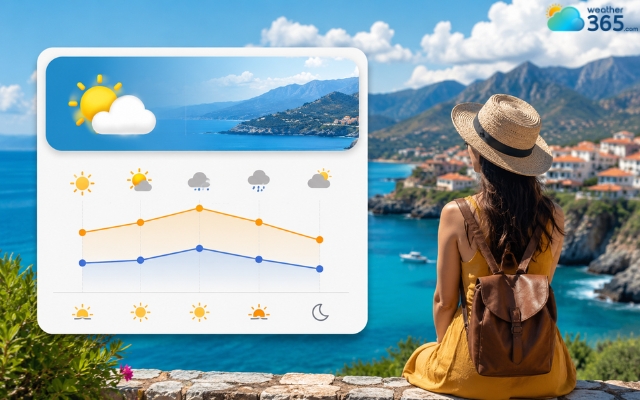
Weather graph widget is useful for travel blogs
Core Features of a High-Performing Weather Graph Widget
To keep your bounce rates low and your site speed high, an effective weather chart component must deliver on four non-negotiable fronts:
Real-Time Data Accuracy & Trusted APIs
A beautiful chart is useless if it's tracking an outdated forecast. High-performing widgets pull hyper-local data from authoritative meteorological models (like ECMWF or GFS) via robust APIs.
Look for options that refresh cache intervals every 10 to 15 minutes to guarantee accuracy without slamming your API call limits.
Fully Responsive & Mobile-Friendly Layouts
More than half of your traffic views charts on mobile devices. A premier widget must dynamically scale down, turning dense weekly graphs into swipeable hourly timelines on smaller touchscreens without breaking your container layout.
Deep Customization (Colors, Fonts, and UI Themes)
To maintain brand consistency, your embed shouldn't look like a generic third-party plugin.
The best widgets allow you to alter CSS properties, match specific hex codes to your brand palette, toggle between dark/light modes, and select typography that blends seamlessly into your existing UI.
For sites looking for an even more immersive experience, upgrading to a 3D weather widget can elevate user engagement to the next level.
Comprehensive Metrics (Temperature, Humidity, UV Index, Wind Speed)
Go beyond basic temperature spikes. A robust visualization tool stacks multiple data layers over a single timeline, allowing users to toggle or overlay humidity curves, UV index exposure levels, barometric pressure trends, and wind speed directions.
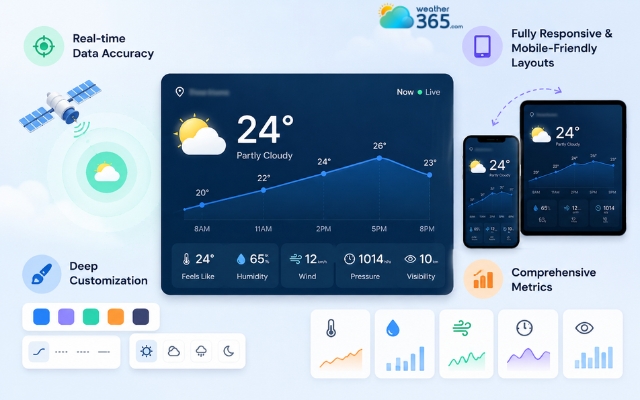
Important features of a weather graph widget
Top Weather Graph Widget Options for Websites
Depending on your technical expertise and project scope, you can choose between ready-made, copy-paste embeds or fully custom frontend charting setups.
Best No-Code Free Widget Embeds
WeatherWidget.io: A favorite among content creators. It offers a purely visual, highly configurable interface that generates safe, lightweight iframe scripts. It is incredibly easy to customize with custom Google Fonts and responsive layouts.
Weather365 Widget: Available at weather widget, this reliable option provides beautifully structured, multi-day weather chart visuals. It is highly optimized for web layouts, delivering precise meteorological trends in an intuitive layout that is easy to generate and add to any web page.
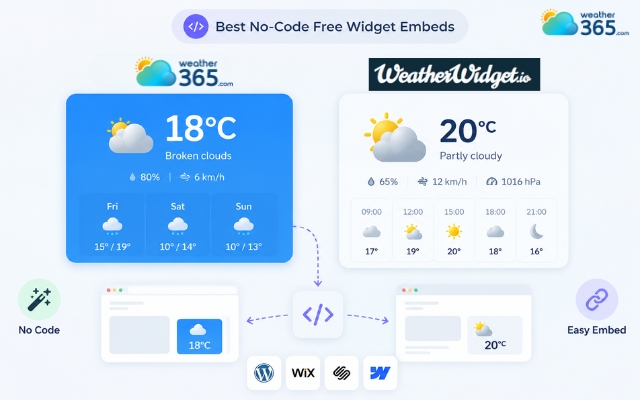
Ready-made widget providers
Best Developer Frameworks for Custom Weather Charts
Chart.js + Weather API: For complete UI control, combine a lightweight charting framework like Chart.js with an API endpoint (like Open-Meteo or Tomorrow.io). This approach lets you render bespoke canvas-based line and bar charts that load instantly.
Leaflet & Radar Overlays: If your platform requires geographic maps layered with real-time precipitation or convective radar graphs, implementing a custom weather map widget via a Leaflet-based JavaScript setup allows you to stitch custom meteorological map tiles directly over interactive user viewports.
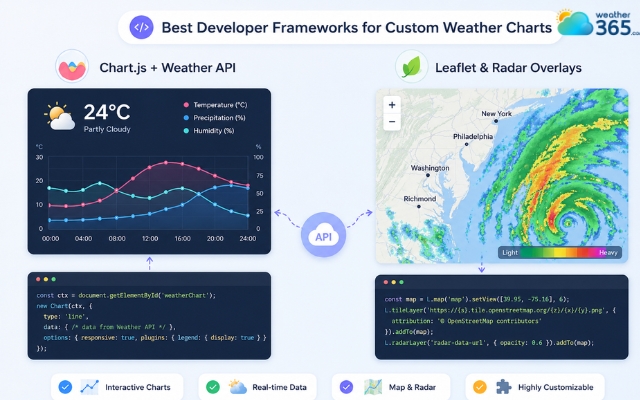
Advanced weather graph widget options
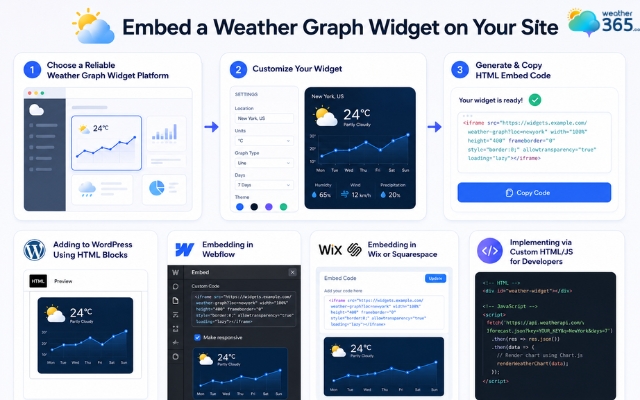
How to Embed a Weather Graph Widget on Your Site
Before putting the widget on your specific platform, you need to go through the foundational setup.
First, navigate to a reliable weather graph widget platform (such as WeatherWidget.io or Weather365).
Once there, use their configuration dashboard to customize the widget settings: adjusting the layout size, selecting your target geographic location, choosing unit preferences (Celsius or Fahrenheit), and fine-tuning the color scheme to match your brand identity.
After customizing, click the generate button to copy the resulting HTML embed code block to your clipboard.
From there, follow these implementation routes based on your system layout:
Adding to WordPress using HTML Blocks
Navigate to your post or page editor. Click the + icon to add a new block and select Custom HTML. Paste your generated widget code snippet (usually an "frame" or a "script" tag) directly into the field.
Click Preview to verify the responsive scaling before hitting publish.
Embedding in Webflow, Wix, or Squarespace
Open your site canvas builder.
In Webflow, drag an Embed element onto your container.
In Wix or Squarespace, add a code block component set to HTML mode. Paste your script, specify your container height constraints (e.g., max-height: 400px), and save.
Implementing via Custom HTML/JS for Developers
Isolate an empty hook container in your markup:
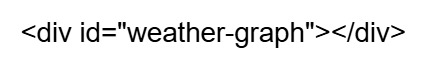
Fetch your target JSON data from your meteorological provider, map the arrays to your charting library configuration variables, and mount the rendered canvas element using your primary entry script.
Easily embedding a weather graph widget
Final Words
A high-performing weather graph widget is the absolute best way to increase dwell time and provide instant, visual value to your audience. Whether you deploy a quick no-code option or code a bespoke framework, seamless installation ensures real-time data flow. Choose your ideal platform setup today and upgrade your site's dynamic layout instantly!
Frequently Asked Questions (FAQs)
Related post

Weather Radar Widget: Best Live & Interactive Display for Your Website

Weather Alert Widget: Top Weather Warning for High-Utility Websites

0 Comment
Leave a comment
Your email address will not be published. Required fields are marked *