How to Read a Weather Map: Isobars, Fronts, Cloud Cover And Pressure
How to Read a Weather Map can feel confusing when you’re staring at random lines, symbols, and colors that make no sense. If you’ve ever checked a forecast and still felt unsure, you’re not alone. Let this guide help you decode weather maps quickly and actually understand what’s coming next.
Learn how to read a weather map
- What is a weather map?
- Basic things you should know
- Pressure Systems (H & L)
- Cold Fronts
- Warm Fronts
- Stationary & Occluded Fronts
- Isobars & Wind
- Colors & Symbols
- How to read a surface weather map?
- Step 1: Start with Pressure Systems
- Step 2: Identify Weather Fronts
- Step 3: Read the Isobars
- Step 4: Look at Symbols and Temperature
- How to read wind speed and direction on a weather map?
- How To Read Air Pressure On A Weather Map
- How to read a radar map?
- How to read cloud cover?
- How to read ocean currents?
What is a weather map?
A weather map is basically a visual snapshot of what’s happening in the atmosphere at a specific moment.
Instead of reading long forecasts or numbers, you get everything displayed at once - pressure systems, wind, temperature, clouds, and even storms all layered onto a single map.
Think of it like Google Maps, but for the sky.
What makes a weather map powerful is that it doesn’t just show current conditions; it helps you see patterns.
For example, you can quickly spot where a storm is forming, how fast it’s moving, or whether clear skies are likely to last.
A weather map is the visualization of the atmosphere
Meteorologists rely on these maps because they reveal connections you wouldn’t notice from a simple temperature reading.
There are also different types of weather maps, each focusing on a specific aspect.
Surface maps show pressure systems and fronts, radar maps highlight precipitation, and satellite maps reveal cloud cover from above.
When combined, they give a much more complete picture of the weather.
Basic things you should know
Before you try to read a full weather map, there are a few core elements you must recognize.
It is the language of the map, and once you understand these, everything else starts to make sense.
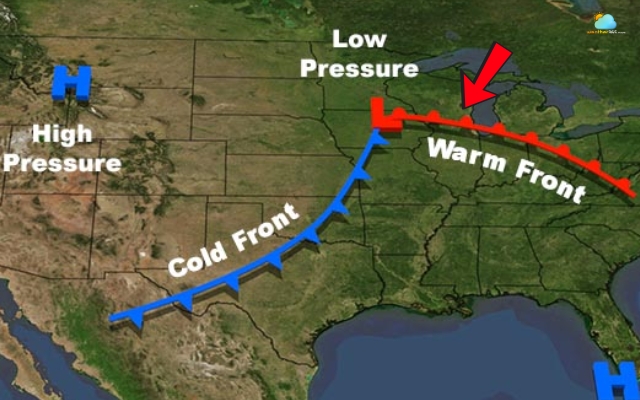
Pressure Systems (H & L)
One of the first things you’ll notice is the letters H and L. These stand for high and low pressure.
A high-pressure area usually means calm, clear weather. A low-pressure area, on the other hand, is where things get more interesting - clouds, rain, even storms tend to form here.
Air pressure is indicated by H and L on the weather map
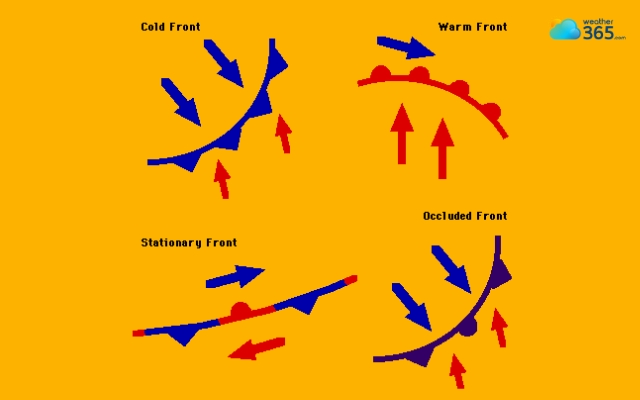
Cold Fronts
Cold fronts are shown as blue lines with triangles. They mark where cold air is pushing into warmer air.
When you see a cold front approaching, expect quick changes: temperature drops, strong winds, and sometimes heavy rain or thunderstorms.
It’s the kind of weather that shifts suddenly within a few hours.
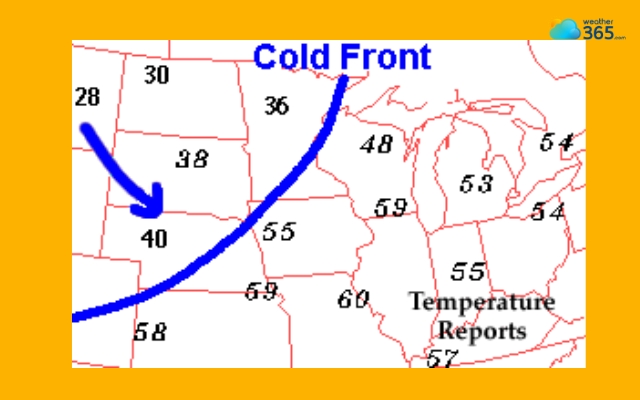
Cold fronts indicate quick changes in the weather
Warm Fronts
Warm fronts are drawn as red lines with half-circles. They represent warm air slowly replacing cooler air.
Unlike cold fronts, warm fronts bring more gradual changes.
You’ll often see steady rain followed by warmer, more humid conditions. It’s less dramatic, but still important to track.
Warm fronts represent warm air in the atmosphere
Stationary & Occluded Fronts
These are a bit more complex but very useful to understand.
A stationary front means two air masses are stuck, not really moving. This often leads to long periods of cloudy, rainy weather.
An occluded front happens when a cold front catches up with a warm front, mixing both systems and creating unstable conditions.
If the weather feels “stuck” and doesn’t change for days, a stationary front is often the reason.
A stationary front often leads to rainy weather
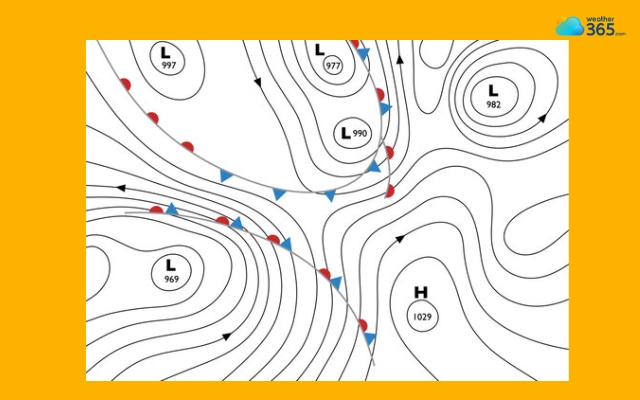
Isobars & Wind
Those curved lines across the map? They’re called isobars, and they connect areas with the same air pressure.
Here’s the key insight:
Isobars close together → strong winds
Isobars far apart → light winds
This happens because wind is driven by pressure differences: the bigger the difference, the faster the air moves.
So instead of guessing wind speed, you can see it instantly just by looking at the spacing.
Learn details about Isobars on a weather map!
Isobars connect areas with the same air pressure
Colors & Symbols
Finally, colors and symbols tie everything together.
Different colors often represent temperature, precipitation, or intensity.
Symbols (like arrows, clouds, or rain icons) give quick clues about what’s happening in each area.
Weather maps use these visuals, so you don’t have to read long explanations; just one glance is enough.
Learn all the symbols of weather here!
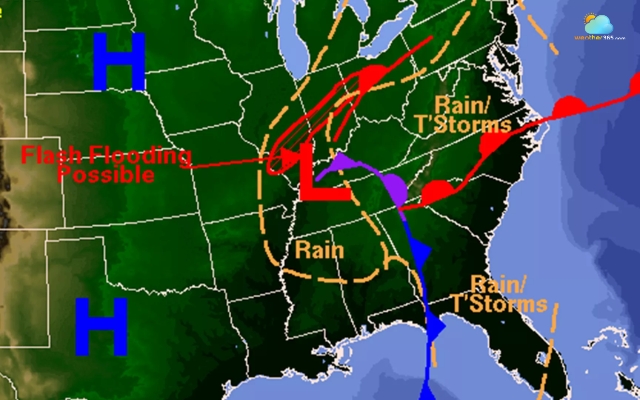
How to read a surface weather map?
A surface weather map shows current weather conditions at ground level, combining multiple elements like air pressure, fronts, wind, and temperature into one view.
At first, it may look complex, but if you follow a clear order, it becomes much easier to understand.
Step 1: Start with Pressure Systems
Look for “H” (high pressure) and “L” (low pressure).
These are the foundations of the map. High pressure usually means clear, stable weather, while low pressure is linked to clouds, rain, or storms.
Step 2: Identify Weather Fronts
Next, find the colored lines. These are fronts - boundaries between air masses.
Cold fronts often bring sudden weather changes, while warm fronts lead to more gradual shifts.
Step 3: Read the Isobars
Check the curved lines around pressure systems.
If they are close together, winds are stronger. If they are far apart, conditions are calmer.
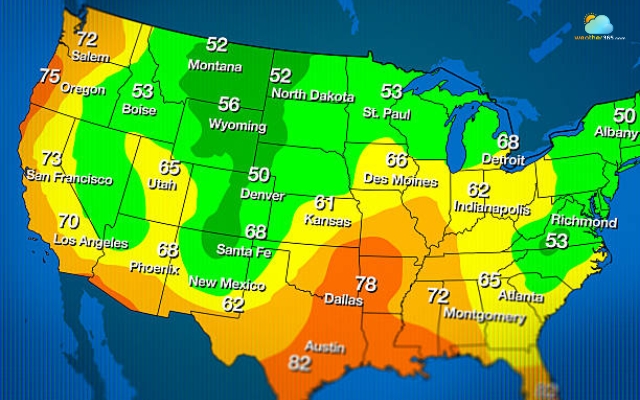
Step 4: Look at Symbols and Temperature
Finally, read the smaller details like weather symbols and temperature.
These show what’s actually happening on the ground: rain, fog, clear skies, and how hot or cold it is.
In some maps, you’ll also see compact symbols (station models) that summarize local conditions like wind, temperature, and cloud cover.
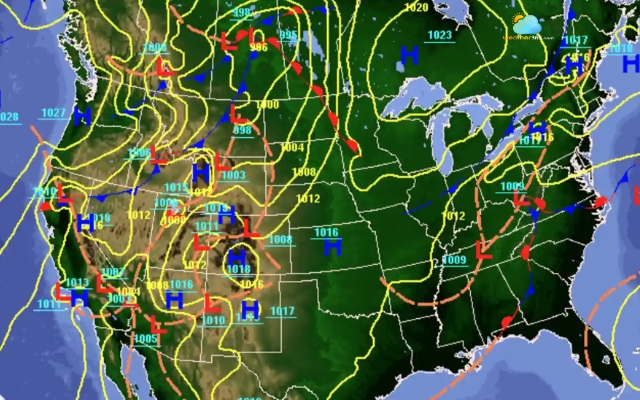
Step-by-step reading a surface weather map
How to read wind speed and direction on a weather map?
Wind on a weather map is usually shown using arrows or wind barbs, and once you understand how to read them, you can quickly tell how air is moving across a region.
The first thing to know is direction.
On most maps, the line (or arrow shaft) points in the direction the wind is coming from, not where it’s going.
For example, if the arrow points from the north, it means the wind is blowing from north to south. This detail often confuses beginners, but it’s essential for reading maps correctly.
Next is wind speed, which is shown by small lines (called barbs) attached to the main shaft. A longer line typically represents about 10 knots of wind, while a shorter one represents around 5 knots.
By counting these lines, you can estimate how strong the wind is without needing numbers.
If you want a deeper, step-by-step explanation, check out the full guide on wind speed and direction to make this even clearer.
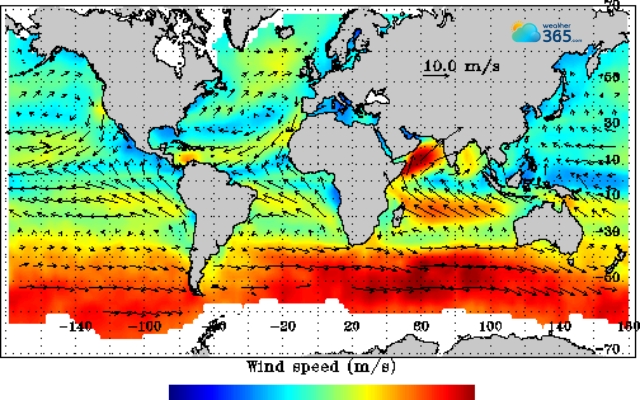
Follow arrows/wind barbs to read wind speed and direction
How To Read Air Pressure On A Weather Map
Air pressure is one of the most important parts of any weather map, and it’s usually shown using isobars - those curved lines that connect areas with the same pressure.
At first, these lines may look confusing, but they actually tell you a lot with very little information.
Start by looking at how the isobars are arranged. They often form circular or oval shapes around high-pressure (H) and low-pressure (L) systems.
If the pressure values increase toward the center, it’s a high-pressure area, which usually brings stable and clear weather.
If the values decrease toward the center, it’s a low-pressure area, often linked to clouds, rain, or storms.
Next, pay attention to the spacing between isobars.
When the lines are close together, it means the pressure is changing quickly over a short distance - this creates stronger winds.
When the lines are spaced far apart, the pressure changes more gradually, and the weather is usually calmer.
Another useful insight is movement. By observing how pressure systems and isobars shift over time, meteorologists can predict whether conditions will improve or worsen.
For example, if a low-pressure system is moving toward your area, there’s a higher chance of rain or unsettled weather.
Check out the guide on how to read a barometer for a deeper explanation!
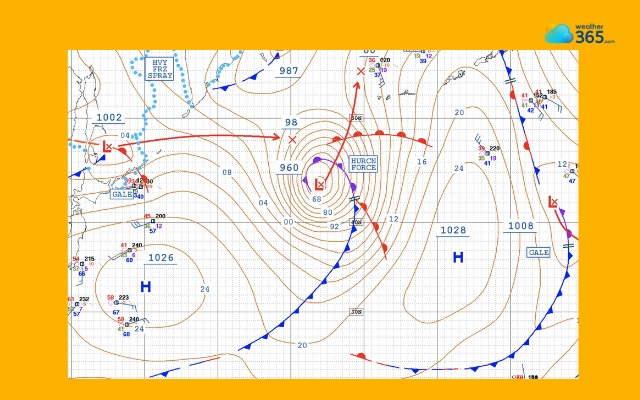
Follow the isobars to check the air pressure
How to read a radar map?
A radar weather map is mainly used to show precipitation in real time, which means rain, snow, or storms happening right now.
Compared to other weather maps, radar maps are more dynamic and help you see what’s coming in the next few hours.
The most important thing to understand is the color scale.
Radar maps use different colors to represent how intense the precipitation is.
In most cases, lighter colors like green or blue indicate light rain, while warmer colors like yellow, orange, or red show heavier rain or thunderstorms.
If you see darker shades like red or even purple, it often means very intense weather that could be severe.
Another key aspect is movement.
Radar maps often update continuously or include animations. By watching how colored areas move, you can tell whether a storm is approaching, passing by, or moving away.
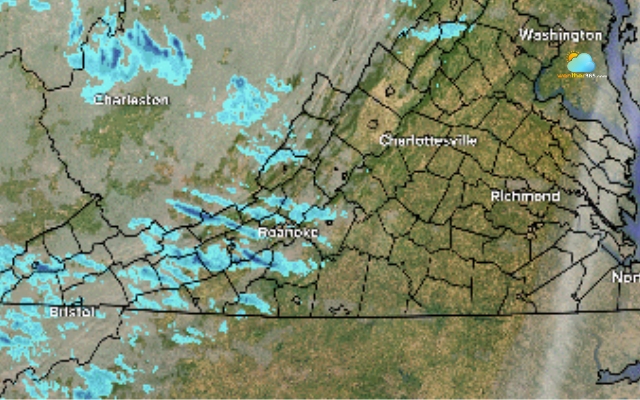
Learn the color scale to read the radar map
How to read cloud cover?
Cloud cover on a weather map shows how much of the sky is covered by clouds, and it plays a big role in how the weather actually feels: sunny, gloomy, or likely to rain.
Confused about “cloud cover”? Discover here!
On most maps, cloud cover is displayed using shading, colors, or small symbols.
A clear area might appear blank or lightly colored, while more cloud-covered regions are shown with darker shades.
In some cases, especially on detailed maps, you may see a circle symbol that is partially or fully filled - this indicates how much of the sky is covered at that location.
There’s also a simple concept behind it: cloud cover is often measured as a percentage or in fractions of the sky.
For example, a fully shaded symbol means overcast (completely cloudy), while a mostly empty one suggests clear or partly cloudy conditions.
What makes cloud cover useful is how it connects to real-world conditions.
More clouds usually mean less sunlight and a higher chance of rain, while clearer areas often indicate more stable, dry weather.
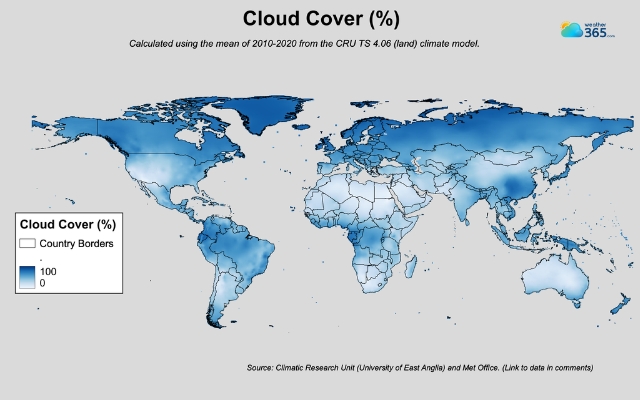
More clouds usually mean a higher chance of rain
How to read ocean currents?
Ocean currents on a weather map show how water is moving across the oceans.
Ocean currents may seem less important than wind or rain, but they actually play a big role in shaping weather patterns.
On most maps, ocean currents are displayed using arrows or color gradients. The direction of the arrows (or the flow of colors) tells you which way the water is moving.
Some maps use warm and cool colors to indicate different flow directions, while others combine arrows with shading to make movement clearer.
Another detail to notice is the intensity of the colors or flow lines.
Smooth, gradual color changes usually indicate slower currents, while sharper, more intense gradients suggest faster-moving water.
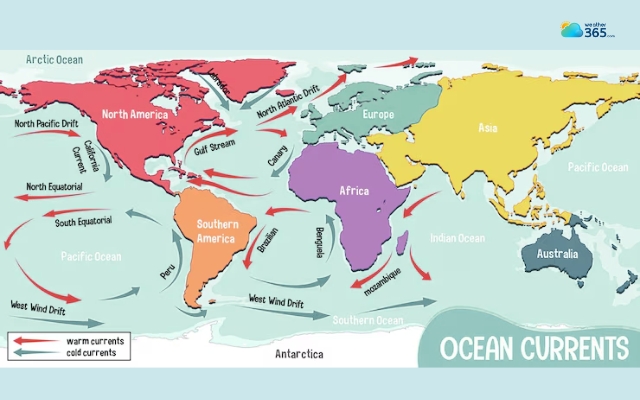
Ocean currents show how water is moving across the oceans
Closing thoughts
Learning how to read a weather map may seem overwhelming at first, but once you understand the key elements, like pressure systems, fronts, and wind patterns, it becomes surprisingly intuitive. With a bit of practice, you’ll be able to quickly interpret forecasts and better understand what’s happening in the atmosphere around you.
Frequently Asked Questions (FAQs)
Related post

Weather Elements Explained: The Essential Components of Our Climate

Symbols On Weather Explained: Master The Weather Maps Like a Pro

0 Comment
Leave a comment
Your email address will not be published. Required fields are marked *