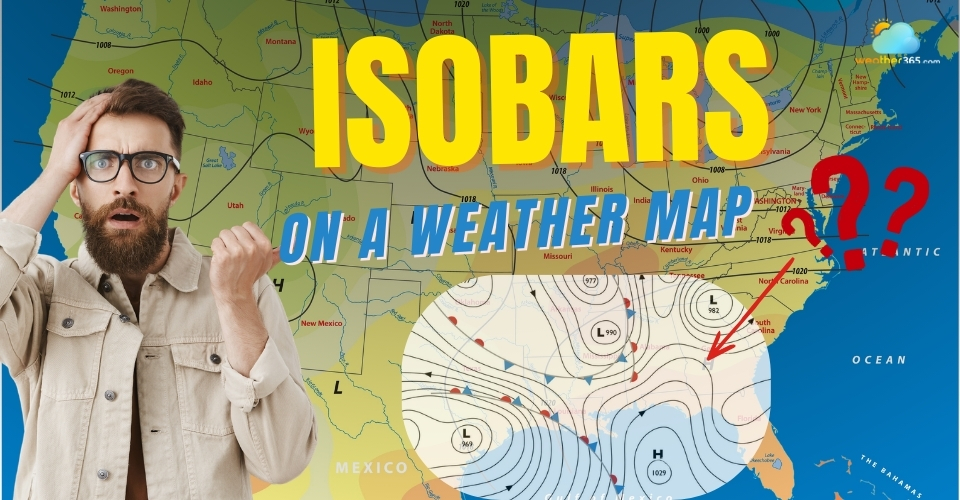
Isobars On A Weather Map: What Are They and How To Read Them Properly
Have you ever noticed the curved lines running across weather maps and wondered what they mean? That’s called an isobar! Isobars on a weather map reveal how air pressure changes across regions and help explain wind patterns and upcoming weather. Keep reading, and you’ll discover everything about isobars and how to read them easily.
What are isobars on a weather map?
What Are The Isobars On A Weather Map?
When you first look at a weather map, you’ll often notice curved or looping lines stretching across different regions.
These lines are known as isobars on a weather map, and they play a key role in helping meteorologists understand what is happening in the atmosphere.
In short, isobars are lines that connect locations with the same atmospheric pressure.
Instead of listing pressure numbers at every single point on the map, meteorologists draw these lines to visually link areas that share identical pressure values.
This makes large-scale pressure patterns much easier to see and interpret.
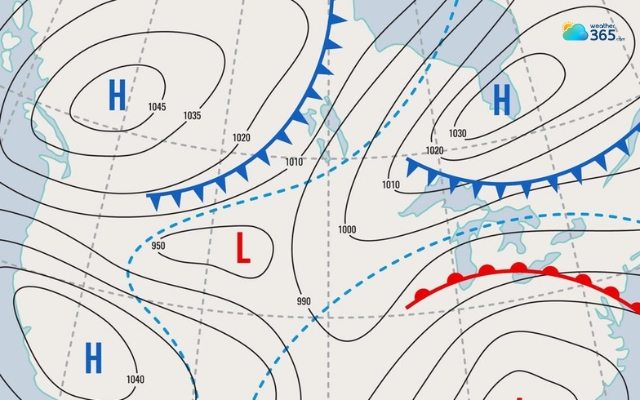
Isobars are curved lines on a weather map
The term “isobar” comes from two Greek words: iso, meaning “equal,” and baros, meaning “weight or pressure.”
In weather science, atmospheric pressure refers to the weight of the air pressing down on the Earth’s surface.
This pressure is usually measured in millibars (mb) or hectopascals (hPa).
Why Meteorologists Use Isobars?
Weather maps contain a huge amount of atmospheric data, but without a clear way to visualize it, that information would be difficult to interpret.
This is why meteorologists rely on isobars on a weather map.
Now let’s see what meteorologists use isobars for!
Identify the pressure system
One of the most important uses of isobars is identifying pressure systems.
When meteorologists see isobars forming loops or large patterns on a map, they can quickly locate areas of high pressure and low pressure.
These pressure systems play a major role in shaping weather conditions, from calm sunny skies to stormy environments.
High and low pressure are located clearly by the isobars
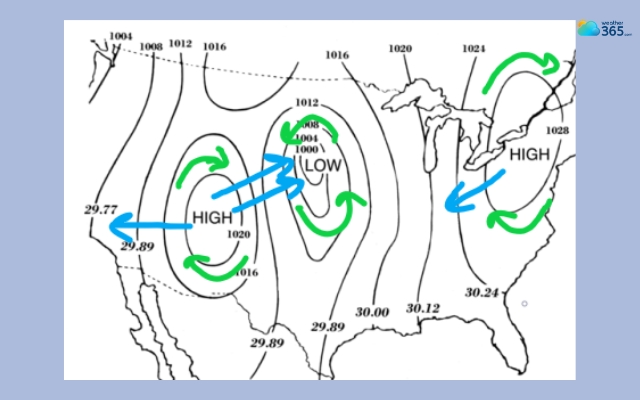
Determine wind speed and direction
Isobars also help forecasters estimate wind speed and direction.
Air naturally moves from areas of higher pressure toward areas of lower pressure, and the spacing between isobars shows how strong that movement may be.
By studying the pattern and distance between these lines, meteorologists can understand how winds will likely behave across a region.
You may also like:
Spacing between isobars shows the air move’s intensity
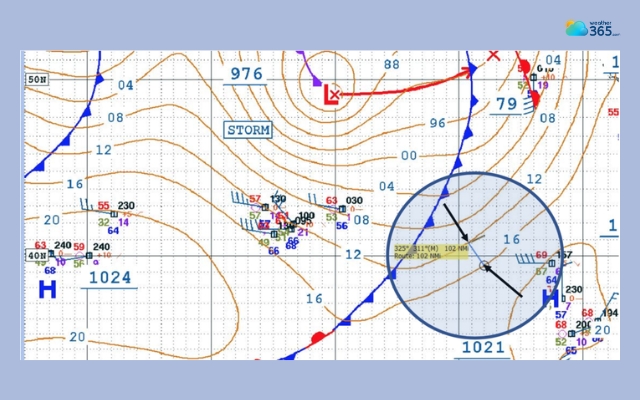
Locate weather fronts
Another useful function is helping experts locate weather fronts.
Fronts are the boundaries where different air masses meet, often bringing sudden changes in temperature, clouds, or precipitation.
The arrangement of isobars often reveals where these boundaries are forming and how they may move over time.
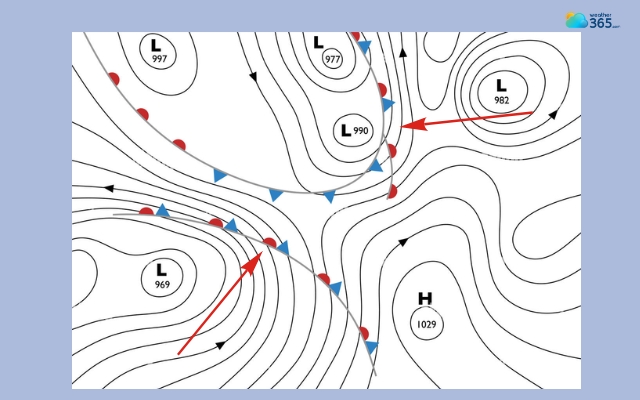
The isobars can show the location of weather fronts
Predict weather changes
Isobars are valuable tools for predicting weather changes.
Shifts in pressure patterns usually signal that the atmosphere is evolving.
By tracking how isobars move or change shape, meteorologists can anticipate developing storms, improving conditions, or other weather transitions before they happen.
Closely Spaced Isobars
Did you notice how close the lines are to each other? Is that distance just random?
The answer is totally NO!
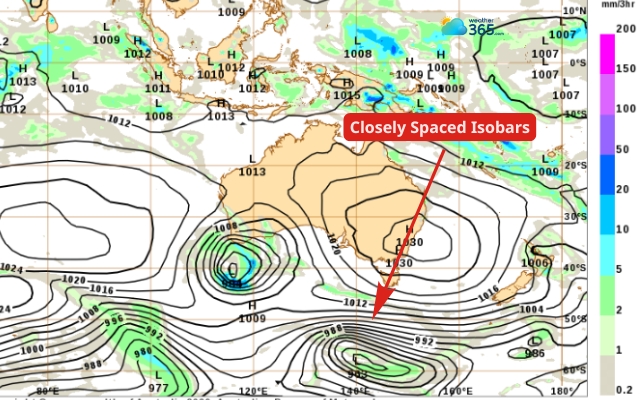
The isobars are very close to each other
If the isobars appear very close together, it means a lot - the atmospheric pressure changes quickly over a short distance.
This situation is known as a strong pressure gradient.
When the pressure difference between nearby areas is large, air moves more rapidly from high pressure toward low pressure.
As a result, wind speeds usually become stronger in areas where isobars are tightly packed.
You’ll often see closely spaced isobars around active weather systems such as storms or deep low-pressure areas.
These patterns signal that the atmosphere is more dynamic and that winds may be stronger in that region.
Because of this, meteorologists pay close attention to these areas when analyzing weather maps.
Widely Spaced Isobars
Similarly, if the isobars appear very far from each other, the pressure difference between nearby locations is smaller and changes more gradually across distance.
This indicates a weak pressure gradient, meaning the force that drives wind is relatively gentle.
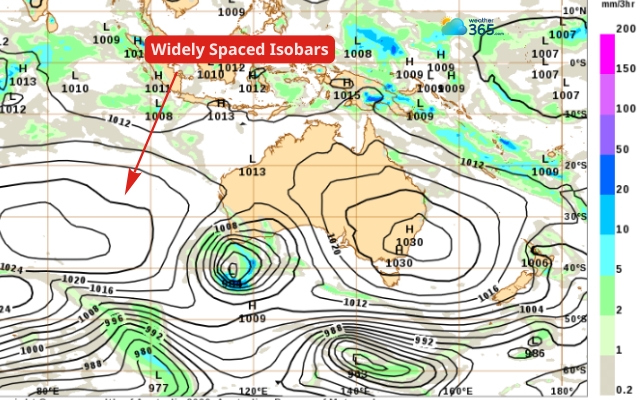
The isobars are very far from each other
In most cases, areas with widely spaced isobars experience lighter winds and more stable atmospheric conditions.
These patterns are commonly found around large high-pressure systems where the atmosphere is calmer.
Although the weather can still change, it usually happens more slowly compared with regions where isobars are tightly clustered.
Circular Isobar Patterns
Another pattern you will often see on weather maps is circular or closed isobar shapes.
Instead of stretching across the map in long lines, the isobars form loops around a central point.
These circular patterns usually indicate pressure centers.
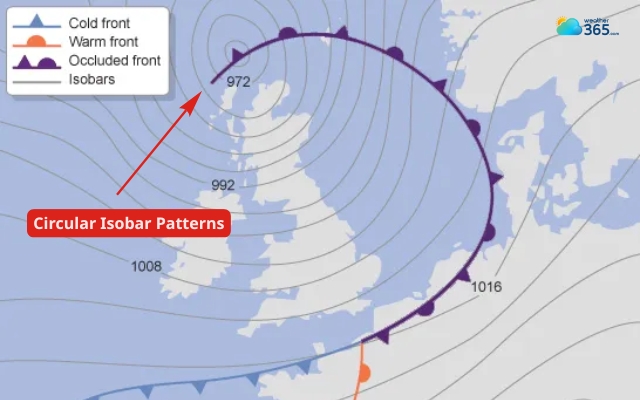
The isobars form loops around a central point
When the pressure decreases toward the center, the pattern represents a low-pressure system.
When the pressure increases toward the center, it represents a high-pressure system.
Meteorologists study these circular formations because they reveal how air flows around pressure systems.
Winds tend to circulate around these centers, helping determine the movement of weather systems and the development of clouds or storms.
Final Thought
Isobars on a weather map might seem confusing at first, but they’re actually one of the easiest clues to understanding how the atmosphere works. By learning how these lines show pressure patterns, reading a weather map becomes much simpler!
Frequently Asked Questions (FAQs)
Related post

The Most Accurate Weather Forecast: Unveiling the Truth

Symbols On Weather Explained: Master The Weather Maps Like a Pro

0 Comment
Leave a comment
Your email address will not be published. Required fields are marked *