Symbols On Weather Explained: Master The Weather Maps Like a Pro
Ever looked at symbols on weather maps and felt completely lost? Those tiny icons, circles, and lines can look confusing at first. But once you understand them, they become a powerful way to read the weather like a meteorologist. Diving in as we’re going to explain what they mean, and show you how to read them quickly and confidently.
Learn what are symbols on weather map
- What Are Symbols on Weather Maps?
- Why Do Weather Symbols Matter?
- Where Can You See Weather Symbols?
- History of Symbols on Weather
- Common Symbols on Weather Maps
- Clear Sky and Cloud Cover Symbols
- Precipitation Symbols
- Wind Symbols (Wind Barbs)
- Pressure Systems and Fronts
- Isobars - Lines of Equal Air Pressure
- How to Read Symbols on Weather Maps?
What Are Symbols on Weather Maps?
Symbols on weather maps are small visual icons that represent different atmospheric conditions.
Meteorologists use them to display a large amount of weather information in a compact, easy-to-read format.
Instead of writing long descriptions like “light rain with moderate wind from the northeast,” a map can display this information instantly using standardized symbols.
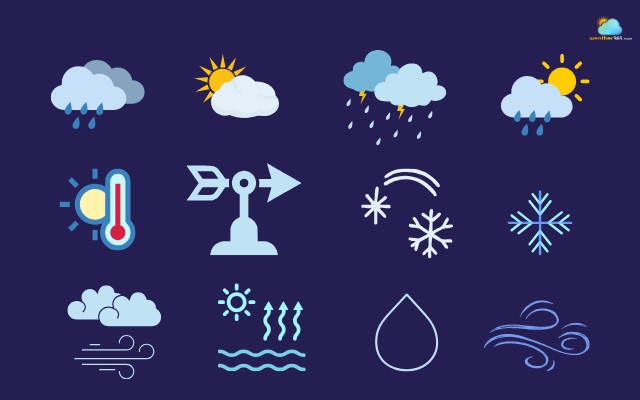
There are many weather icon types
Why Do Weather Symbols Matter?
Weather maps need to show a huge amount of data at the same time.
Think about everything that affects the weather: wind direction, temperature, pressure systems, cloud cover, precipitation, and more.
Writing all of that information in text would make a map impossible to read.
Symbols solve this problem by turning complicated data into simple visual signals.
Weather symbols make weather interpretation easier
These symbols are also important because they create a universal language for weather forecasting.
Scientists, pilots, sailors, and forecasters around the world can read the same weather map and interpret it the same way.
This shared system is especially critical in fields like aviation and marine navigation, where understanding weather conditions quickly can affect safety.
Even for everyday users, learning the meaning of weather symbols on a weather map can make forecasts much easier to understand.
Instead of simply seeing that rain is predicted, you can see where the storm is coming from, how strong the winds are, and how pressure systems are shaping the weather pattern.
Where Can You See Weather Symbols?
You might be surprised by how often you encounter symbols on weather in daily life.
They appear in many modern tools and platforms, even if we don’t always notice them.
One of the most common places people see them today is in weather apps.
Many smartphones display simplified weather icons that represent conditions like sunshine, clouds, rain, or snow.
Weather websites are another place where these symbols appear frequently.
Forecast platforms like Weather 365 often include interactive maps that display cloud cover, precipitation, wind direction, and pressure systems using standardized weather icons.
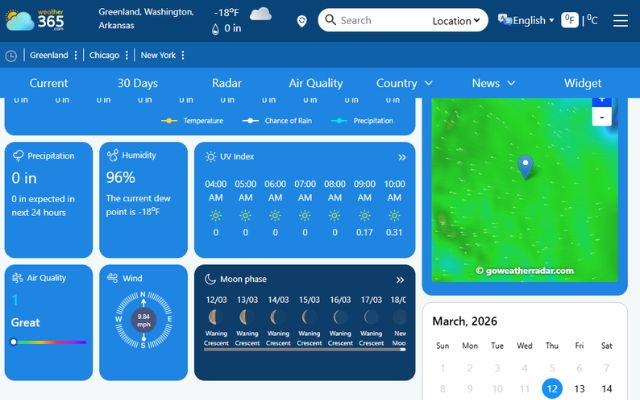
Weather 365 uses symbols to make things easier to understand
If you zoom into a forecast map, you’ll often notice symbols representing rain intensity, wind barbs, or moving fronts.
You’ll also see these symbols in many places, like professional forecasting environments, aviation/marine forecasts,...
The next time watching a weather forecast, carefully pay attention to the screen, and you’ll be surprised at how frequently weather symbols are used!
History of Symbols on Weather
In the early 19th century, weather information was recorded mainly in written reports.
Meteorologists would describe conditions such as cloud cover, wind, and rainfall using text.
But as weather observations started coming from many locations at once, writing everything out became slow and difficult to analyze.
Hand-drawn synoptic charts
To solve this problem, forecasters began drawing synoptic charts - hand-made weather maps that used small marks and simple symbols to represent atmospheric conditions.
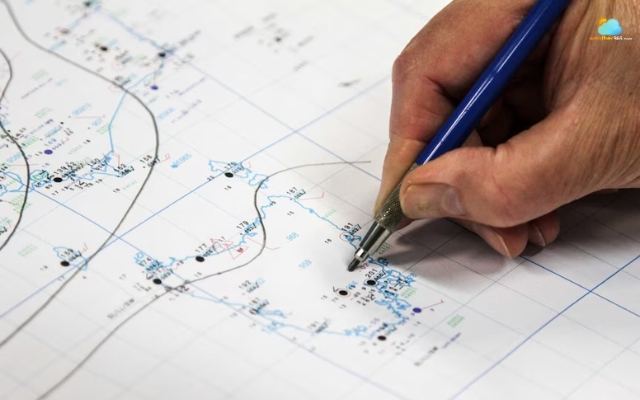
Forecasters had to draw synoptic charts by hand
Telegraph-era meteorology
A major turning point came during the telegraph era.
With the invention of the telegraph, weather stations could send observations across long distances in a matter of minutes.
However, telegraph messages had to be short and efficient.
Meteorologists started using compact codes and visual symbols to represent weather conditions, allowing data to be plotted quickly on a single map.
Over time, these early systems evolved into standardized meteorological symbols.
Today, the same basic system of weather symbols on a weather map is still used, although it is now created digitally.
Modern forecasting tools, satellite imagery, and weather apps still rely on these symbols to visualize atmospheric data quickly and clearly.
Common Symbols on Weather Maps
You may find that weather symbols are so confusing. But once you learn the basic symbols on weather maps, everything starts to make sense.
Now let’s explore the most common weather symbols on a weather map and what they actually tell us about the atmosphere.
Clear Sky and Cloud Cover Symbols
Cloud coverage is one of the easiest weather symbols to recognize.
It tells us how much of the sky is covered by clouds at a specific location.
On many consumer weather platforms, cloud conditions are shown using simple icons like a sun for clear skies or clouds for overcast weather.
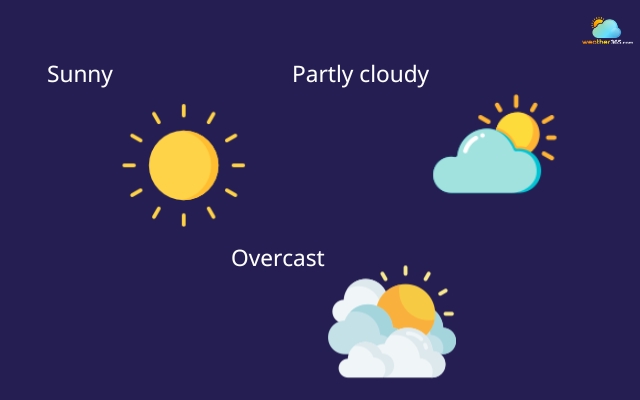
Symbols of sunny, partly cloudy, and overcast
But on professional weather maps, meteorologists often use station model circles.
The circle in a station plot represents the sky condition at that location.
The amount of shading inside the circle shows how much of the sky is covered by clouds.
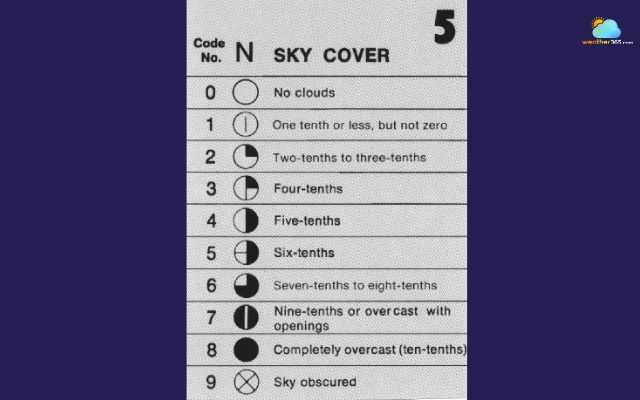
Cloud coverage circles used in station models
Precipitation Symbols
Precipitation symbols show what type of moisture is falling from the atmosphere.
These are some of the most important symbols on weather maps because they reveal where rain, snow, or other conditions are occurring.
Different shapes represent different types of precipitation.
Small dots usually indicate rain, while asterisks or star-like marks represent snow.
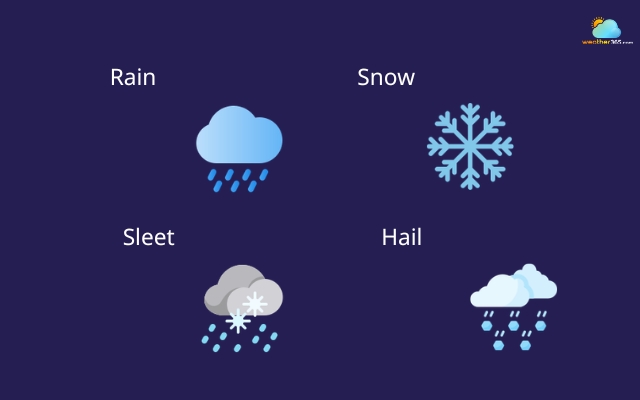
Symbols indicate precipitation
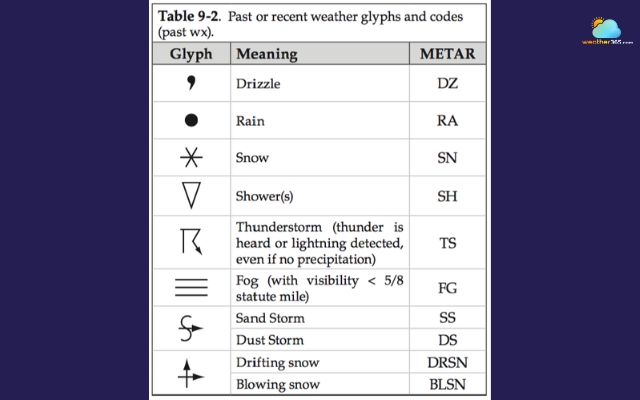
Precipitation on professional weather maps
Intensity is also communicated through these symbols.
For instance, a single mark might mean light rain, while multiple symbols grouped together can indicate heavier precipitation.
Modern weather apps often simplify these into icons such as a cloud with raindrops or snowflakes.
Even though they look different from professional charts, they are based on the same meteorological principles.
Wind Symbols (Wind Barbs)
Wind plays a major role in shaping weather patterns, and meteorologists represent it using wind barbs.
A wind barb is a line with small markings attached to it. This symbol communicates two things at once: wind speed and direction.
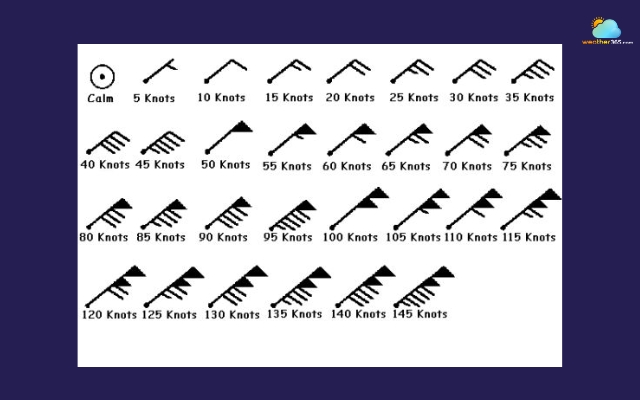
Wind barbs are used to indicate wind speed and direction
The main line shows where the wind is coming from.
If the line points north, it means the wind is blowing from the north. This simple visual cue helps meteorologists understand airflow across large regions.
The small marks attached to the line represent wind speed.
Each mark corresponds to a specific wind speed value measured in knots.
Meteorologists combine these marks to show the exact wind speed at a location.
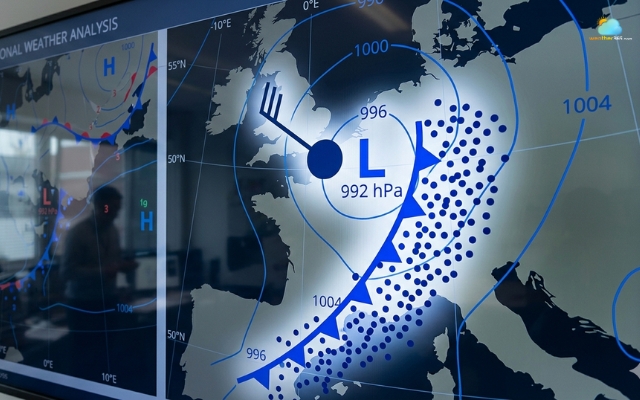
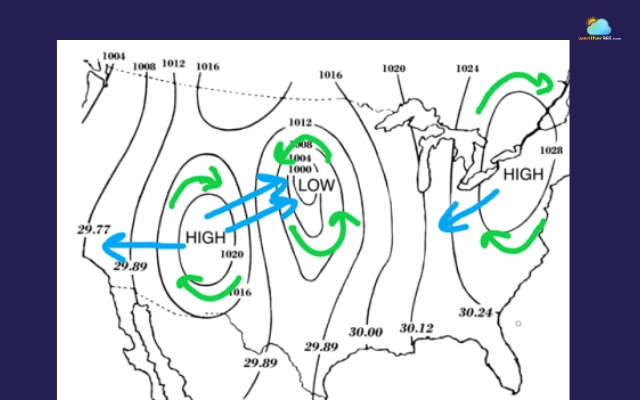
Pressure Systems and Fronts
Another key part of weather symbols on a weather map is the display of pressure systems and atmospheric fronts.
Pressure systems are usually marked with large letters:
H represents a high-pressure system
L represents a low-pressure system
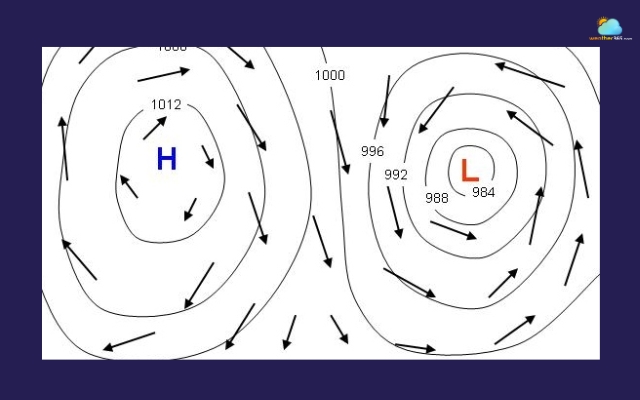
Symbols of high and low pressure
Weather fronts mark the boundary between two different air masses. These are usually shown as colored lines with specific shapes.
For example:
A blue line with triangles represents a cold front
A red line with semicircles represents a warm front
A purple line often indicates an occluded front
Alternating red and blue symbols show a stationary front
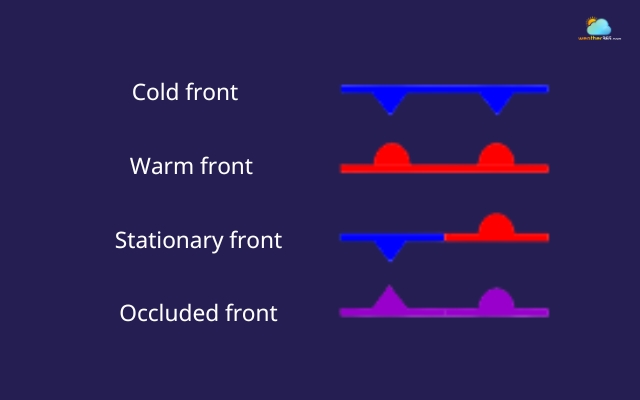
Symbols of 4 types of front
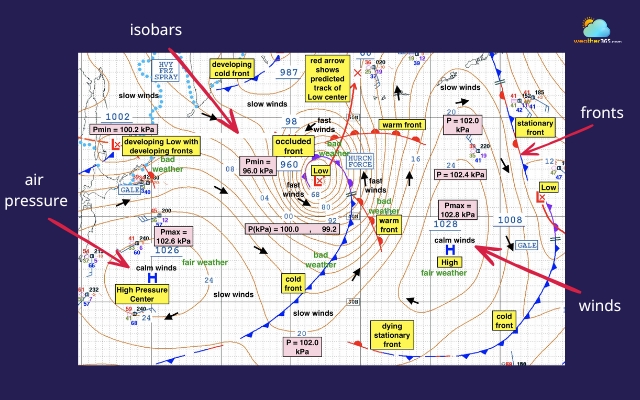
Isobars - Lines of Equal Air Pressure
Isobars are another essential element on weather charts.
These are curved lines that connect areas with the same atmospheric pressure.
When isobars are spaced far apart, it usually means the pressure difference across the region is small.
In these conditions, winds tend to be light, and the weather may remain relatively stable.
When isobars are tightly packed together, the pressure difference is larger.
This often leads to stronger winds because air moves from high pressure toward low pressure more rapidly.
Curious about the meaning of curved lines on weather maps? Check out our guide on Isobars on a weather map!
Isobars indicate pressure patterns, wind speed and direction
How to Read Symbols on Weather Maps?
A good way to approach symbols on weather maps is to read the map step by step.
First, look for large pressure systems marked with “H” and “L”.
High pressure often means stable weather, while low pressure usually indicates clouds, rain, or storms.
Next, check the weather fronts.
Cold fronts, warm fronts, and stationary fronts show where different air masses meet.
These boundaries often bring changing weather conditions such as rain or thunderstorms.
After that, pay attention to wind symbols and isobars.
Wind barbs tell you the wind direction and speed, while isobars reveal how strong the pressure difference is across an area.
When isobars are close together, winds are typically stronger.
Finally, zoom in on station observations. This is where meteorologists get detailed local weather data.
Look at each symbol to step-by-step interpret the weather map
Final Thought
Understanding symbols on weather maps can completely change the way you look at forecasts. Instead of just checking if it will rain or shine, you can actually see how pressure systems, winds, and clouds interact. Once you learn these symbols, reading a weather map becomes much clearer, and even a little fun.
Frequently Asked Questions (FAQs)
Learn details about the differences between Euro and GFS here!
◉ H stands for high pressure, which usually brings calm and clear weather.
◉ L stands for low pressure, which is often associated with clouds, rain, and storms.
Related post

The Most Accurate Weather Forecast: Unveiling the Truth

0 Comment
Leave a comment
Your email address will not be published. Required fields are marked *