Weather Widget for Construction: Top Tools and How To Embed One
Unpredictable weather can instantly stall projects and spike labor costs. Integrating a precise Weather Widget for Construction safeguards your crew and bottom line from sudden microbursts. Explore our expert breakdown of top real-time site tracking tools and learn how to embed them effortlessly to secure your jobsite today!
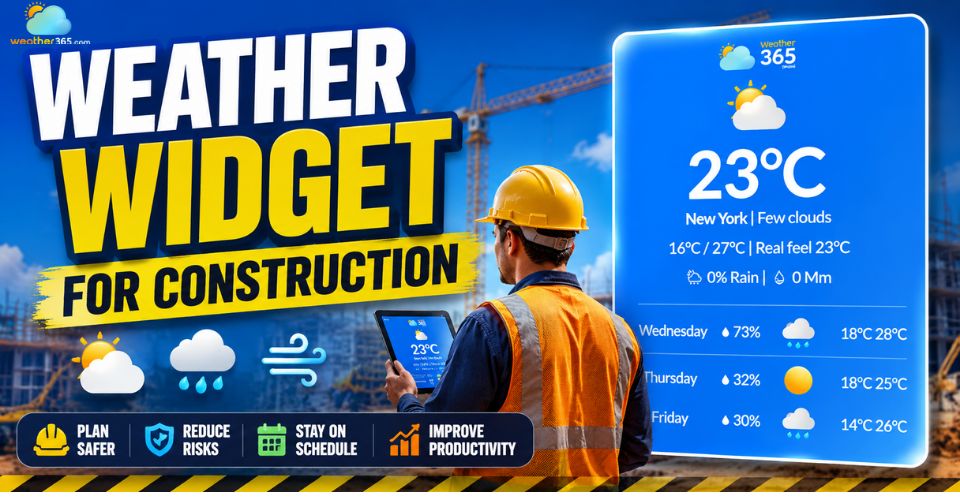
Weather widget for construction
- Key Features to Look For in a Construction Weather Widget
- Hyper-Local, GPS-Based Forecasting
- Real-Time Wind Speed and Gust Alerts
- Wet-Bulb Globe Temperature (WBGT) & Heat Index Tracking
- Historical Weather Logging
- How Visualizing Weather Data Improves Jobsite Efficiency
- Top Weather Widget for Construction
- Steps to Integrate a Weather Widget into Your Construction Dashboard
Key Features to Look For in a Construction Weather Widget
The best construction weather widget must deliver precise, real-time environmental data tailored directly to your site's coordinates rather than generic city averages.
While you can explore how different sectors leverage these tools in our guide to Weather Widgets by Industry, construction sites require a highly specific set of capabilities:
Hyper-Local, GPS-Based Forecasting
Standard city weather forecasts don't work for construction sites because weather can change completely within just a few miles.
If you rely on a weather station miles away, you risk wasting money on false alarms or getting caught in sudden rain that ruins your work.
Much like choosing a Weather Widget for Agriculture where field-level precision is non-negotiable, a good construction widget solves this by tracking weather at your exact GPS coordinates.
This gives you highly accurate storm updates for your specific layout, catching local weather shifts that big regional reports miss.
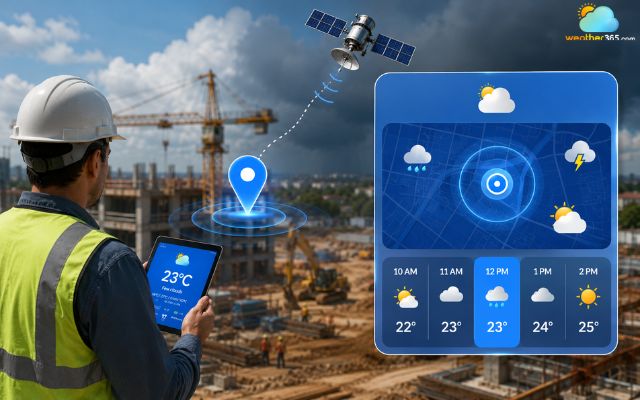
A reliable widget uses point-specific weather data
Real-Time Wind Speed and Gust Alerts
Wind can turn a normal workday into a dangerous crisis in seconds, so high-altitude work needs real-time wind updates rather than hourly reports.
Cranes: Tower and mobile cranes generally face strict operational shutdowns when sustained winds or sudden gusts exceed 20 mph to 30 mph.
Scaffolding: Working on open scaffolding becomes unsafe at similar thresholds due to wind-shear risks and the danger of loose materials blowing offline.
To prevent accidents, your widget should feature instant push notifications to warn your safety officer before these dangerous gusts actually hit your equipment.
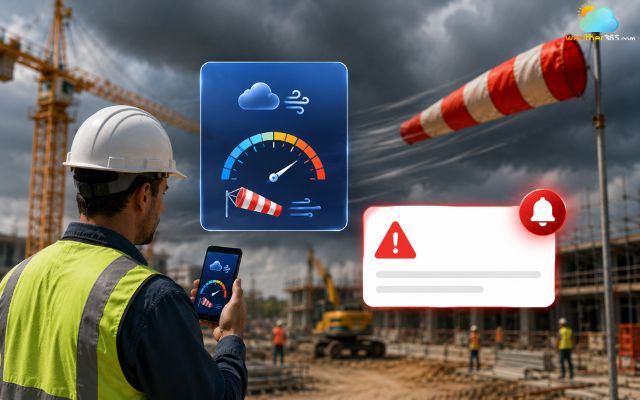
Weather widget for construction needs accurate wind data
Wet-Bulb Globe Temperature (WBGT) & Heat Index Tracking
Air temperature alone cannot tell you if it is safe for your crew to work.
To protect your workers and follow labor laws, you need to track two key numbers:
Heat Index: shows how hot it feels in the shade using temperature and humidity.
Wet-Bulb Globe Temperature: measures heat stress directly under the sun by factoring in wind and solar radiation.
Tracking these helps you set clear break times and drinking schedules, keeping your crew safe and your company out of legal trouble.
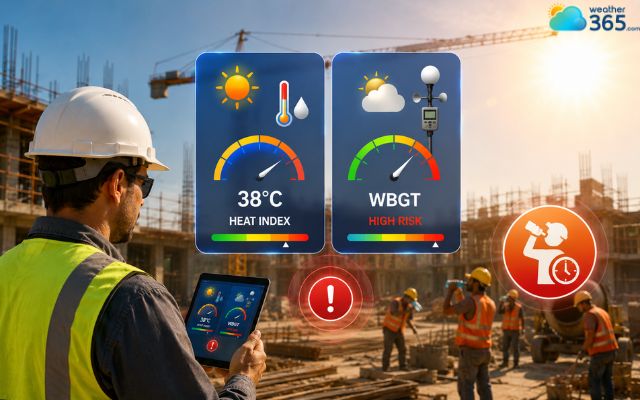
The construction weather widget must have heat data
Historical Weather Logging
When you face delays or damaged materials, guesswork will not protect your money.
Automated logging creates a permanent digital record of the exact weather at your site coordinates.
This long-term environmental data is not just useful during building; it also adds immense value later when integrating a Weather Widget for Real Estate to showcase property resilience and historical climate safety to future buyers.
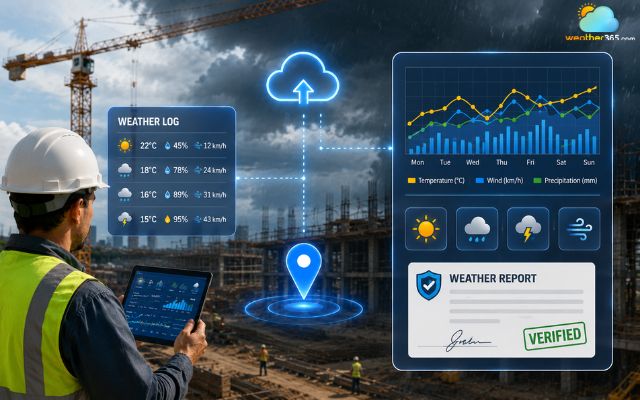
Weather widget for construction should have historical data
How Visualizing Weather Data Improves Jobsite Efficiency
Visual weather data helps jobsites run much more smoothly. It turns complicated weather numbers into quick scheduling choices.
Clear, color-coded dashboards remove all guesswork.
This allows project managers to check the daily plan at a single glance
Optimizing Scheduling for Weather-Sensitive Tasks
A visual timeline shows the exact weather windows you need for specific tasks.
It highlights dry windows above 40°F (4.5°C) for pouring concrete to ensure proper curing. It also shows low-humidity periods for perfect painting adhesion.
Finally, it flags dry, low-wind days for safe roofing and framing work.
Enhancing Crew Safety and Compliance
A visual dashboard acts as your site’s safety command center. The screen flashes automatic warnings when lightning or strong winds get within 10 miles.
This gives safety officers a clear countdown so they can easily secure equipment and evacuate high-altitude crews before the storm hits.
Streamlining Subcontractor Coordination
Sharing one central weather widget stops you from wasting money on idle labor. The dashboard might show a major storm 24 to 48 hours ahead.
In that case, you can quickly tell subcontractors to switch to indoor work. This ensures teams never show up to an unworkable site.

A weather widget can improve construction work efficiency
Top Weather Widget for Construction
Need a reliable weather widget for construction? Take a look at these 3 most well-known weather widget providers on the market today!
Weather365 Widget
Weather365 stands out as a highly adaptable platform specializing in customizable global weather tracking.
It offers robust, embeddable iframe widgets that handle point-specific coordinates flawlessly, making it an excellent choice for construction teams seeking localized, real-time dashboards without a complex development cycle.
Tomorrow.io Widget
Known for its specialized "Weather Intelligence" architecture, Tomorrow.io provides construction-focused dashboard templates.
Its system offers advanced automated forecasting alongside customizable threshold alerts for lightning, wind, and heatwave management, designed specifically to reduce material loss and project downtime.
The Weather Channel Widget
Leveraging enterprise-grade data feeds via its comprehensive B2B API Hub, The Weather Company delivers deep meteorological insights.
It provides extensive current, forecast, and historical data packages, making it a reliable backend solution for large-scale construction enterprises.
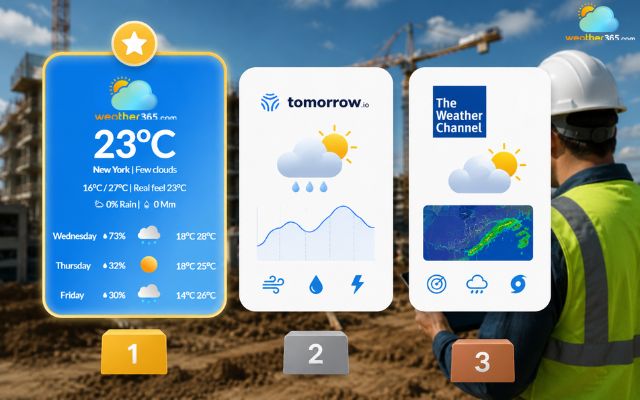
Top reliable weather widget providers
Steps to Integrate a Weather Widget into Your Construction Dashboard
Ready to get a weather widget for construction?
Follow these simple steps!
Step 1: Select Your Data Provider
Choose a provider that matches your technical infrastructure.
For quick, low-code deployment, look for a customizable iframe widget.
For native, deeper dashboard integration, opt for a robust weather API provider.
Step 2: Configure Site Coordinates
Do not use generic zip codes.
Input the exact latitude and longitude coordinates of your active jobsite boundary into the widget configurator to ensure point-specific microclimate tracking.
Step 3: Establish Custom Threshold Alerts
Set up specific operational triggers tailored to your project.
For example, program the widget interface to flash red or send out an automated SMS alert if sustained wind speeds are projected to exceed 20 mph or if lightning is detected within a 10-mile radius.
Step 4: Embed the Code into Your Portal
Copy the generated iframe or JavaScript code block from your provider's backend.
Paste it directly into custom dashboard tabs within project management software like Procore, Autodesk Construction Cloud, BIM 360, or your company's internal portal.
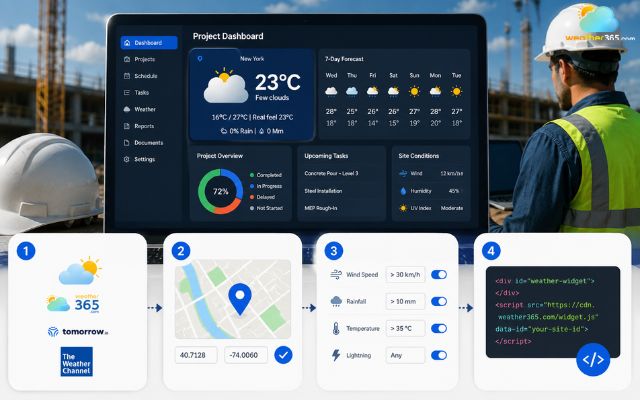
Easy steps to add a weather widget to a construction website
Final Words
Adding a weather widget for construction to your dashboard is a game-changer for your project. Real-time, hyper-local tracking helps you beat delays, save on labor costs, and keep your crew safe. Pick the best tool for your jobsite, embed the code, and start building smarter today!
Frequently Asked Questions (FAQs)
Related post

Weather Widget for Outdoor Business: Free Live Forecasts for Your Site

Weather Widget for Agriculture: Embed a Live Farming Track in Seconds

0 Comment
Leave a comment
Your email address will not be published. Required fields are marked *