How to Embed a Live Pollen Count Widget on Your Website
Looking for a pollen count widget to keep your visitors updated with real-time allergy risks? A live pollen tracker can increase engagement by up to 30% on health and weather sites while improving user trust. In this guide, you’ll discover how it works, why it matters, and how to add one to your website in just a few steps. Let’s start!
Pollen count widget
- Understanding Pollen Count Widget
- Why Add a Pollen Count Widget to Your Website?
- Value Proposition
- The Allergy Audience
- Top Pollen Count Widgets and Tools for Websites
- Pollen.com Allergy Alert Widget
- Meteoblue Daily Weather & Pollen Widgets
- Google Maps Pollen API (custom integration APIs)
- How to Embed a Pollen Count Widget (Step-by-Step)
Understanding Pollen Count Widget
A pollen count is a metric that measures the concentration of pollen grains in a specific volume of air over a given timeframe (typically 24 hours).
It is used to gauge the potential severity of seasonal allergies (allergic rhinitis or "hay fever") for a specific area.
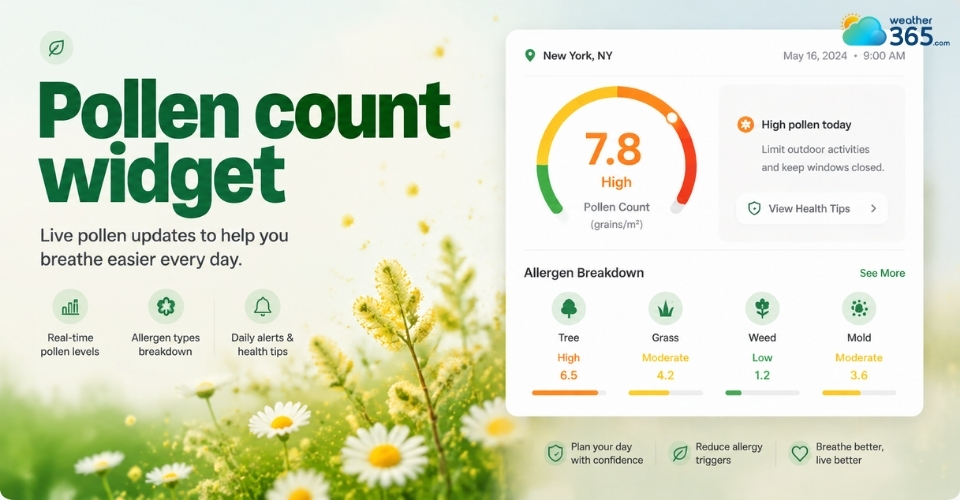
A pollen count widget is a small, embeddable tool that displays real-time or forecasted pollen levels for a specific location.
A pollen count widget helps users understand the current concentration of allergens such as tree, grass, and weed pollen in the air.
In simple terms, it answers the question: “Is today a bad day for allergies in my area?”
Most widgets pull data from meteorological or environmental APIs and convert it into an easy-to-read visual format - often using color-coded risk levels (low, moderate, high, very high).
Some also allow users to enter a ZIP code or auto-detect location for instant results.
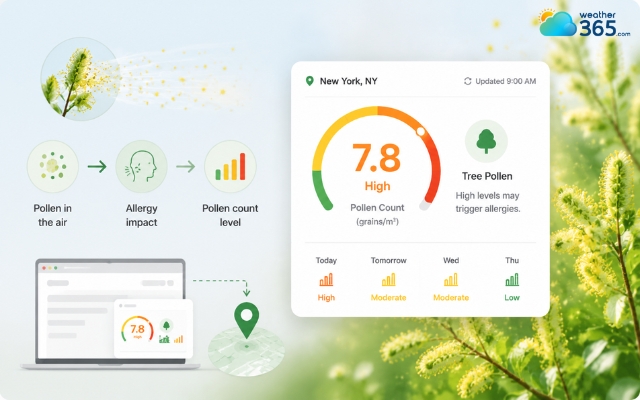
Understanding a pollen count widget
Why Add a Pollen Count Widget to Your Website?
Adding a pollen count widget helps your website deliver real-time allergy information that keeps users engaged and encourages them to return regularly for updates.
Websites that already use live environmental tools like a Weather Metrics Widget can further improve user engagement by adding allergy tracking features.
Value Proposition
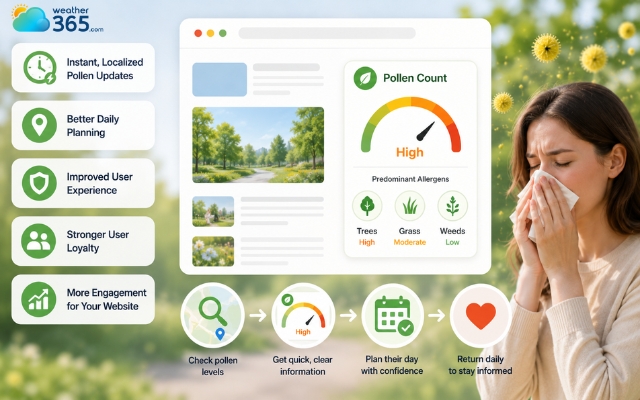
A live pollen count widget turns your website into a practical daily resource instead of a static information page.
When users can quickly check allergy levels in real time, they are more likely to stay longer and explore other content on your site.
This is especially valuable for local news platforms, health blogs, and weather websites, where timely environmental data directly improves user experience.
Instead of searching elsewhere, visitors get instant answers about outdoor conditions, which increases trust and repeat visits.
From an SEO perspective, this kind of interactive feature can also improve key engagement signals like time-on-site and page return rate.
Over time, this helps strengthen your site’s authority in seasonal and location-based search queries.
A pollen count widget can improve page return rate
The Allergy Audience
The demand for pollen tracking is not small.
In the United States alone, more than 1 in 4 adults experience seasonal allergies, and millions of people actively check pollen forecasts during high-risk periods like spring and early summer.
These users are highly intent-driven; they don’t browse casually but look for immediate answers such as “Is pollen high today?” or “Is it safe to go outside?”
Also, many visitors who track allergy conditions check tools like a UV Index Widget before planning outdoor activities
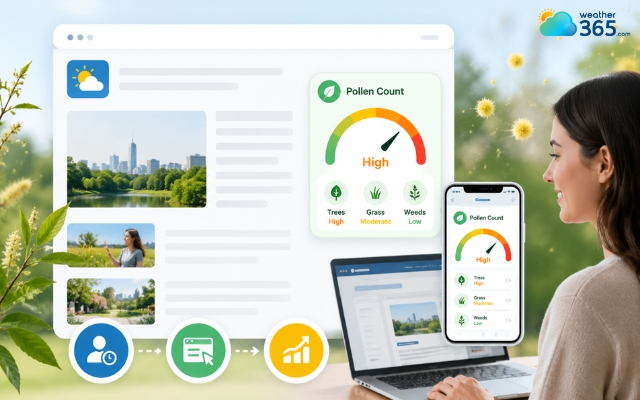
A pollen count widget directly meets this need by providing fast, localized, and easy-to-understand data.
Because of this behavior, websites that offer live allergy updates naturally become part of users’ daily routine, especially during peak allergy seasons when tracking pollen levels becomes a priority.
A pollen count widget provides direct and fast answers
Top Pollen Count Widgets and Tools for Websites
There are several reliable pollen count tools available, ranging from simple plug-and-play widgets to advanced developer APIs, allowing any website to provide live allergy information tailored to its audience.
Top pollen count widgets include Allergy Alert Widget, Meteoblue Daily Weather & Pollen Widgets, and Google Maps Pollen API.
Pollen.com Allergy Alert Widget
The Pollen.com Allergy Alert Widget is one of the most popular free options for U.S.-based websites.
It offers a simple interface where visitors enter their ZIP code to see a one-day hay fever report and the predominant allergens in their area.
Its biggest advantage is ease of use: the widget can be embedded with minimal setup and requires no coding knowledge.
While design flexibility is limited, it delivers clear, concise allergy information quickly, making it ideal for health blogs, local news platforms, or small weather websites that want a fast solution.
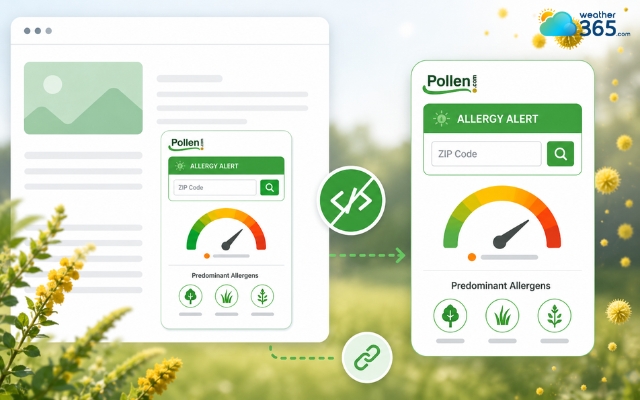
Allergy Alert Widget is one of the most popular free options
Meteoblue Daily Weather & Pollen Widgets
The Meteoblue Daily Weather & Pollen Widgets provide a more polished and customizable option.
These widgets combine pollen forecasts with weather and even an Air Quality Widget experience, helping users monitor multiple environmental conditions in one place.
Users can select forecast ranges and adjust display settings, making it suitable for websites that want both functionality and a modern look.
With global coverage, Meteoblue widgets are especially useful for international audiences or websites that want a more comprehensive environmental tracking solution.
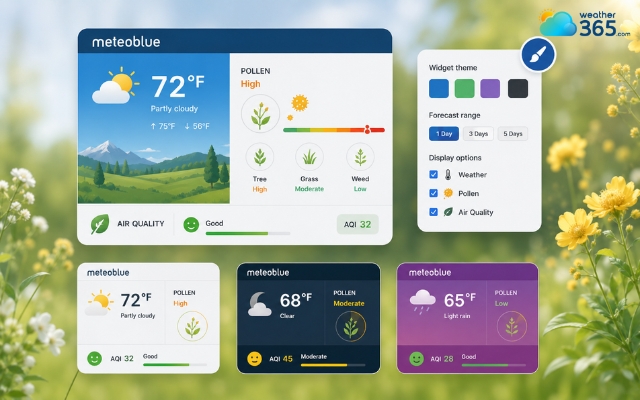
Meteoblue Daily Weather & Pollen Widgets has global coverage
Google Maps Pollen API (custom integration APIs)
For developers and enterprise applications, the Google Maps Pollen API offers the most advanced solution.
It provides hyper-local pollen data down to a 1x1 km grid, 5-day forecasts, detailed plant-level information, and interactive heatmap tiles for over 65 countries.
While it requires coding and custom UI development, this API allows complete flexibility in design and data presentation.
Websites or apps using this API can offer highly specific insights for tree, grass, and weed pollen, making it ideal for global weather platforms, research dashboards, or custom health apps.
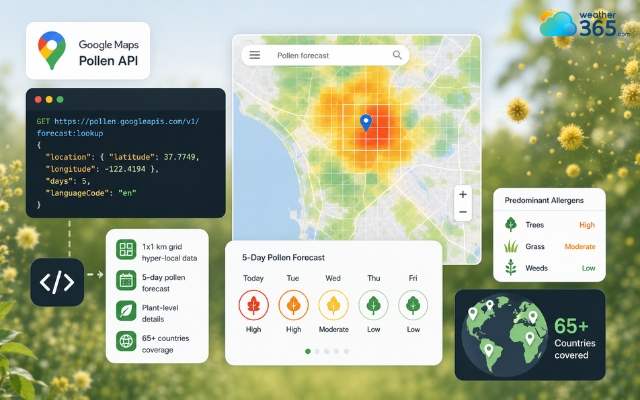
Google Maps Pollen API is an advanced solution
Feature/Metric | Pollen.com Allergy Alert Widget | Meteoblue Weather & Pollen Widgets | Google Maps Pollen API |
Type of tool | Plug-and-Play Widget | Customizable Widget / Feed | Developer REST API |
Setup Difficulty | Very Easy | Easy | Advanced |
Design Flexibility | Limited | Moderate | Unlimited |
Data Coverage | United States primary focus | Global | Global (Grid-based down to 1km) |
Data Granularity | Overall Allergy Index (0–12 scale) | Mixed weather data + basic air/pollen indicators | Deep breakdowns |
Mobile Responsiveness | Fair | Excellent | Depends entirely on your custom UI code |
Cost structure | Free | Free tiers available / Paid options | Pay-as-you-go (Google Cloud Credits) |
Best for | Quick setup on local US blogs or health sites. | Weather platforms wanting responsive, sleek, pre-designed UI elements. | Enterprise apps, custom global dashboards, and tailor-made UI/UX. |
How to Embed a Pollen Count Widget (Step-by-Step)
Easily add a pollen count widget by following the 4 steps below!
Step 1: Choose Your Pollen Widget or API
Start by selecting a tool based on your website’s needs and technical skills. For quick setup, Pollen.com offers a simple plug-and-play option.
If you want more design flexibility and international coverage, Meteoblue widgets are ideal.
For full customization and hyper-local data, the Google Maps Pollen API is the best choice, though it requires coding.
Step 2: Customize Your Widget
Once you’ve chosen a tool, customize it to match your website.
Most platforms allow you to set a location or auto-detect a user’s area, adjust the size, and choose a display style, such as a compact inline box or a larger panel.
Step 3: Generate and Add the Embed Code
After customizing, the platform will provide an HTML or JavaScript snippet. Copy this code and paste it into your website’s backend.
On WordPress or similar CMS platforms, you can use an HTML block or widget area.
For Wix or Squarespace, simply use the embed section.
On custom-coded sites, insert the snippet directly into your page’s HTML.
Step 4: Test and Go Live
Before publishing, check that the widget displays correctly on both desktop and mobile devices. Make sure location detection works and that data updates in real time.
Once everything looks right, save your changes and make the page live.
Your website now provides a dynamic pollen tracker that updates automatically, keeping your visitors informed and engaged.
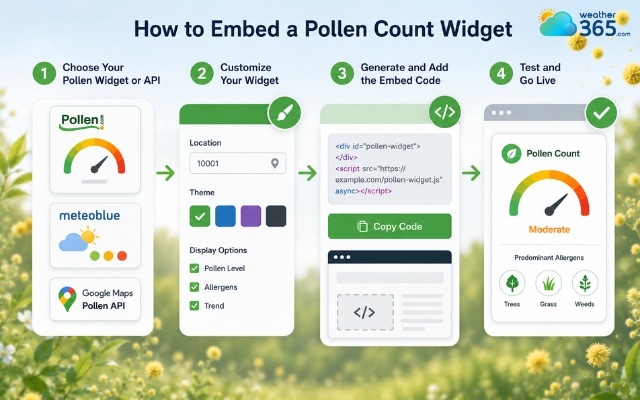
Steps to add a pollen count widget to your website
Sum up
Integrating a pollen count widget into your website provides real-time allergy data that keeps your audience informed and engaged. By delivering accurate, hyper-local air quality insights directly on your platform, you enhance user experience, boost daily traffic, and establish your site as a trusted, go-to resource during peak allergy seasons.
Frequently Asked Questions (FAQs)
Related post

Air Quality Widget: Complete Guide to Embed Live AQI on Your Website

How to Embed a Barometric Pressure Widget on Your Website?

0 Comment
Leave a comment
Your email address will not be published. Required fields are marked *