Air Quality Widget: Complete Guide to Embed Live AQI on Your Website
Air Quality Widget tools now power thousands of local websites, helping visitors monitor pollution levels in real time before planning outdoor activities. From schools to travel platforms, adding live AQI data can boost trust, engagement, and user experience. Read on to learn the fastest ways to integrate AQI into your website!
Air quality widget
- What is the Air Quality Index (AQI) and Why Track It?
- Which Industry Websites Need to Integrate the Air Quality Widget?
- How to Add a Real-Time Air Quality Index Widget to Your Website
- The Easiest Way: Using a Free Widget
- The Custom Way: Use a REST API (Developer Method)
- Using Web Plugins
- Choosing the Best Air Quality Widget: 5 Key Features to Look For
What is the Air Quality Index (AQI) and Why Track It?
The Air Quality Index (AQI) is a standardized measurement system showing how clean or polluted the air is and what health effects people may experience from exposure.
It is commonly used by government agencies such as the United States Environmental Protection Agency.
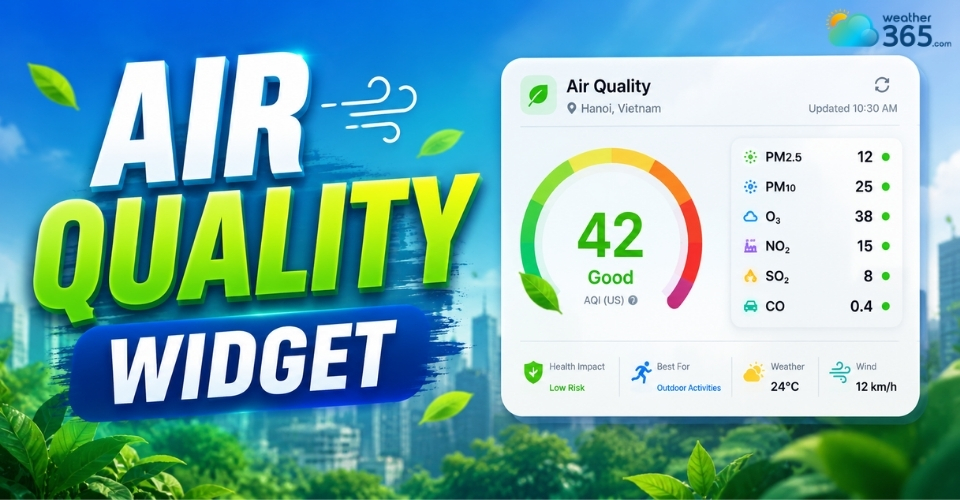
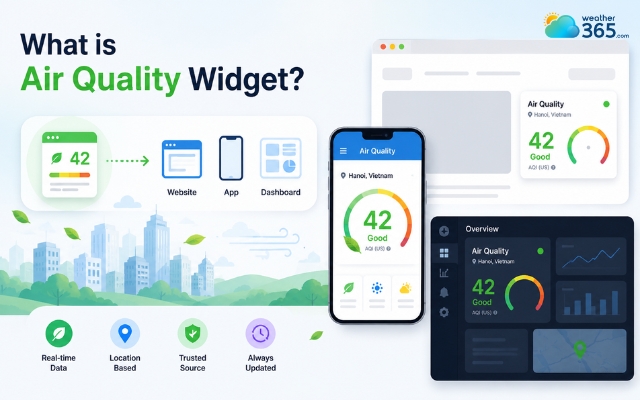
Air quality widget is a small, embeddable tool you can place on a website, app, or digital dashboard that displays real-time information about the air quality in a specific location.
It usually shows the Air Quality Index (AQI), along with potential health effects.
Just like a UV Index Widget warns visitors about sun exposure, an AQI widget alerts users about outdoor air quality, helping them plan safer activities.
The Air Quality Index is to show how clean/polluted the air is
Understanding the AQI chart
AQI Range | Color | Health Concern Level | Meaning/Action |
0-50 | Green | Good | Air quality is satisfactory; poses little or no risk. |
51-100 | Yellow | Moderate | Acceptable, but active children and adults with respiratory issues should limit outdoor exertion. |
101-150 | Orange | Unhealthy for Sensitive Groups | General public is unlikely to be affected; sensitive groups may experience health effects. |
151-200 | Red | Unhealthy | Everyone may begin to experience health effects; members of sensitive groups may experience more serious effects. |
201-300 | Purple | Very Unhealthy | Health alert: everyone may experience more serious health effects. Avoid outdoor activities. |
300+ | Maroon | Hazardous | Health warning of emergency conditions. The entire population is more likely to be affected. |
Which Industry Websites Need to Integrate the Air Quality Widget?
Industries that need to integrate the air quality index includes: Real estate, Travel, Healthcare, and Education.
Now let’s see why these industries should have an AQI widget on their website, and how it can benefit their business!
Real Estate & Property Platforms
Modern homebuyers increasingly consider environmental quality before choosing where to live.
Real estate websites that display neighborhood AQI data provide hyper-local insights that improve trust and user engagement.
Buyers can instantly compare cleaner and more polluted areas before scheduling visits.
Many platforms now integrate AQI alongside Weather Metric Widgets to provide a full overview of local living conditions, including temperature, humidity, and wind.
Travel, Hospitality & Eco-Tourism
Hotels, eco-resorts, and local tour operators can use AQI widgets to showcase healthy outdoor conditions.
For destinations known for nature experiences, displaying clean air data becomes an added selling point that encourages bookings and longer stays.
Healthcare, Clinics & Wellness Websites
Respiratory clinics, pediatric centers, and wellness businesses often rely on AQI updates to alert visitors about poor air conditions.
Displaying live air quality information also strengthens medical credibility and supports health-conscious audiences.
Local Education & Smart School Portals
Schools can use AQI widgets to help parents understand whether outdoor sports, recess, or events are safe during high pollution days.
International schools especially benefit from displaying transparent environmental information.
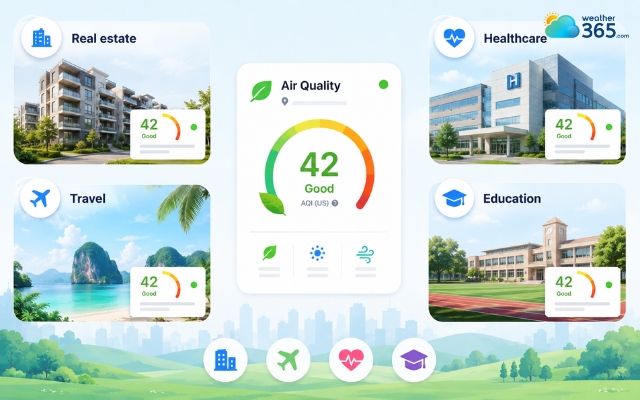
Industries benefit most from an air quality widget
How to Add a Real-Time Air Quality Index Widget to Your Website
To add an Air Quality widget to your website, you can use a free widget, a REST API, or simply take advantage of the website plugins.
The Easiest Way: Using a Free Widget
If you just want to display a live reading, embedding a pre-made widget is the best option. You simply copy and paste an HTML code snippet onto your site.
AirNow: Provides customizable dial and forecast widgets primarily for US locations. Get the code at AirNow AQI Widgets.
AQI.in: Offers global widgets that update in real-time. Grab your code at Free AQI Widgets.
Airly: Perfect if you have a local sensor nearby. Find a sensor and get your widget code at Airly Sensor Map.
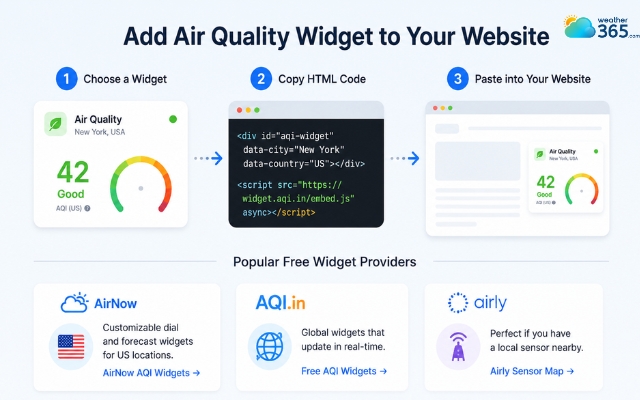
Embed a ready-to-use air quality widget
The Custom Way: Use a REST API (Developer Method)
If your site requires displaying data seamlessly within your own design or mapping it dynamically, you should use an API.
You'll make an HTTP request to fetch the data and render it using HTML/CSS/JavaScript.
World Air Quality Index (WAQI): Offers a widely used, global, and free API for developers. You can access their documentation and get a token at WAQI API.
Google Maps Air Quality API: Great for integrating air quality layers into maps and retrieving highly specific data for a given coordinate.
Many weather dashboards combine multiple sensors, integrating barometric pressure widgets alongside AQI readings to give users a complete picture of local environmental conditions.
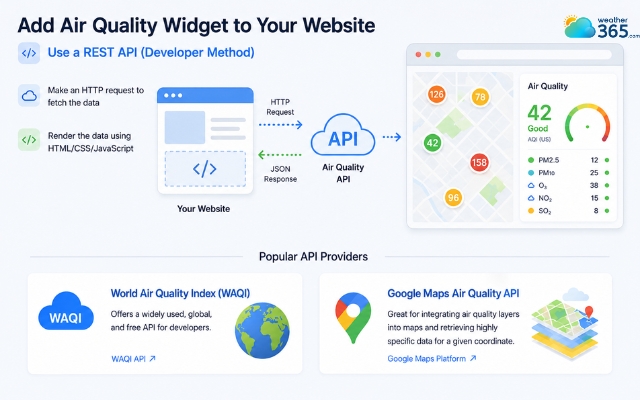
Use the API to create an air quality widget
Using Web Plugins
Adding an Air Quality Index (AQI) via a web plugin is the most efficient way for platforms like WordPress to display live data without manual coding.
Recommended WordPress AQI plugins include Location Weather, Weather Station, and Air Quality Index Widget.
Step-by-Step Instruction
1. Install and Activate the Plugin
Go to your WordPress dashboard
Select Plugins → Add New
Search for a plugin like “Location Weather” or “Air Quality Index”
Click Install Now
Click Activate
2. Get an API Key
Most AQI plugins require an API key from providers such as WAQI or Google Maps. After registering for an account, copy the API key into your plugin settings page.
3. Customize the Widget
Adjust:
City or location
Widget dimensions
Refresh intervals
Theme colors
AQI scale preferences
4. Embed on Your Website
Place the widget in homepage sections, weather sidebars, local information pages, footer widgets,...
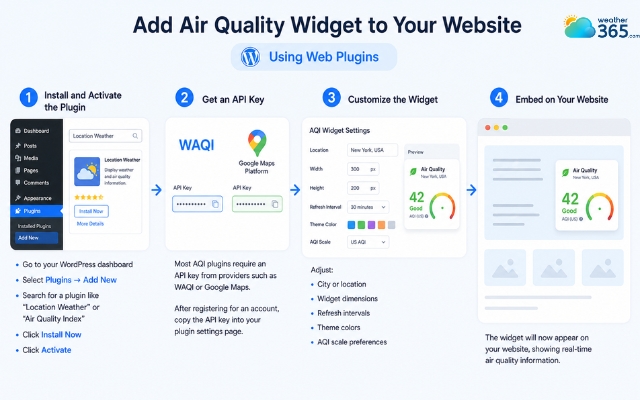
Adding an air quality widget using a website plugin
Adding an air quality widget is too time-consuming?
Weather365 might be exactly what you need - quickly check the live AQI in your location and its potential impacts on your health within seconds!
Just:
Navigate to Weather365
and search for your location in the search bar
Here’s what you’re gonna see!
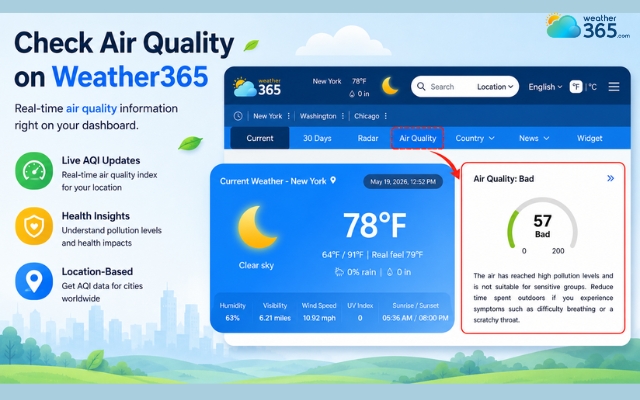
Easily check the air quality on Weather365
Choosing the Best Air Quality Widget: 5 Key Features to Look For
5 key features to look for in a good air quality widget are: Real-time data accuracy, Auto-location detection, Comprehensive Pollutant breakdown, Responsive UI, and Multi-index compatibility.
Real-Time Data Accuracy & Refresh Rates: Choose providers that frequently update pollution data. Delayed AQI information can reduce reliability and negatively affect user trust.
Auto-Location & IP Geotargeting (GEO Essential): Geo-targeted AQI widgets automatically display air quality data based on the visitor’s location. This improves personalization and increases engagement for local audiences.
Comprehensive Pollutant Breakdown: The best widgets display detailed pollutant metrics, including: PM2.5, PM10, Ozone (O₃), Nitrogen dioxide (NO₂), Carbon monoxide (CO). This gives users a clearer understanding of air conditions beyond a single AQI score.
Responsive UI & Custom Dimensions: Your AQI widget should work smoothly across desktop, tablet, and mobile devices. Flexible dimensions also help the widget fit different layouts without slowing page performance.
Multi-Index Compatibility (US AQI vs. CAQI): Some international audiences may use different AQI systems, such as: US AQI, CAQI (Common Air Quality Index), European AQI standards. Supporting multiple index systems improves usability for global visitors.
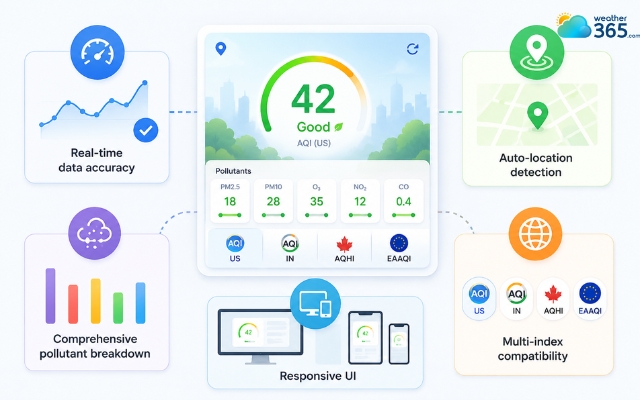
Features in a standard air quality widget
Sum up
In short, an air quality widget improves user trust, increases local relevance, and helps visitors make healthier decisions in real time. Whether you run a real estate platform, healthcare site, travel portal, or fitness community, integrating AQI data can create a more useful and engaging user experience.
Frequently Asked Questions (FAQs)
Related post

UV Index Widget: Best Live UV Tracking Tools for Online Platforms

How to Embed a Barometric Pressure Widget on Your Website?

0 Comment
Leave a comment
Your email address will not be published. Required fields are marked *