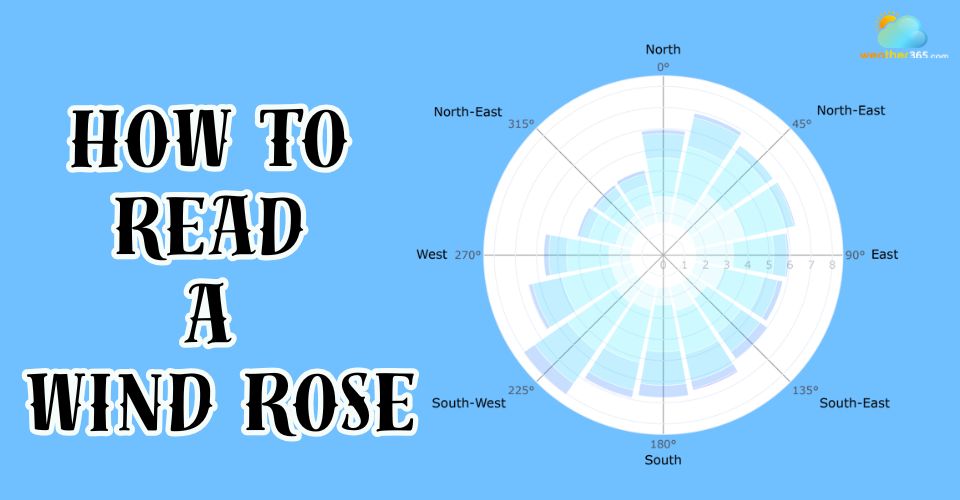
How To Read A Wind Rose? Step-by-Step Guide To Interpreting Wind Data
A wind rose is used to show the general wind speed and direction for each sampling period. How to read a wind rose? It is not as difficult as you think. Follow Weather365 to learn more about what a wind rose is and the easy steps to understand this wind map type.
How to read a wind rose chart?
- What Is A Wind Rose?
- Components Of A Wind Rose
- Direction
- Frequency
- Speed
- Scale
- How To Read A Wind Rose?
- Identify the Wind Direction
- Look at the Frequency
- Check the wind speed
- Read the Circular Scale
- Check Calm Conditions
- Common mistakes to avoid
- Where Wind Roses Are Used?
- Where To Find A Wind Rose?
- Limitations of Wind Roses
What Is A Wind Rose?
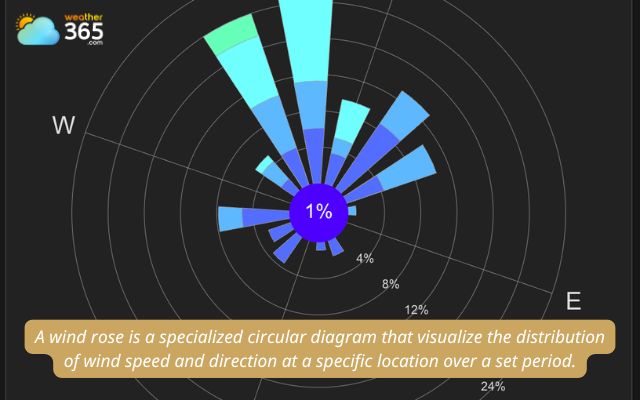
A wind rose is a specialized circular diagram that visualizes the distribution of wind speed and direction at a specific location over a set period.
By mapping historical meteorological data onto a compass-style chart, it illustrates the frequency and intensity of winds originating from every cardinal direction.
Instead of using dense data tables, a wind rose uses radiating "spokes" to represent the percentage of time the wind blows from a particular direction.
The length of these rays indicates the frequency of the wind, while color-coded segments or varying widths within each ray represent different speed categories.
This allows analysts to instantly identify the "prevailing wind"—the direction from which the wind blows most often.
Definition of a wind rose
The name "wind rose" finds its roots in the Latin term rosa ventorum, or "rose of the winds,".
It is inspired by the ornate, petal-like lines that radiated from the center of early maritime compasses.
Emerging between the 13th and 16th centuries, these symmetrical designs featured branching arms that mimicked the appearance of a blooming flower, serving as both a vital navigation tool for sailors and a symbol of protection at sea.
While it began as a visual guide to the 8, 16, or 32 wind directions on nautical charts, the concept underwent a scientific transformation during the 18th and 19th centuries.
It transitioned from a decorative compass card into a precise numerical table.
Eventually, by 1843, the graphical polar-coordinate chart was used to analyze wind frequency and atmospheric patterns.
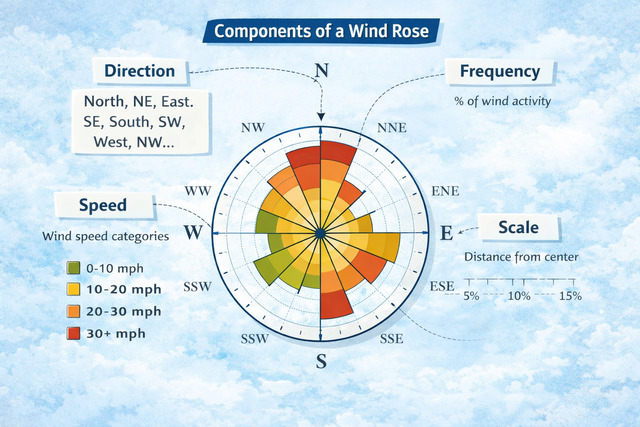
Components Of A Wind Rose
A wind rose is composed of several specific geometric elements that translate raw data into a scannable map.
Each component represents a different dimension of wind behavior recorded over a specific period.
Direction
The wind rose is laid out on a circular grid representing the 360° of a compass. It identifies where the wind is blowing from, not where it is going.
-
Sectors: Most diagrams use 8, 16, or 36 directional sectors.
-
The Orientation: North is always at the top (0°), East at 90°, South at 180°, and West at 270°.
Frequency
Frequency tells you how often the wind originates from a specific direction over a set period (monthly, seasonally, or annually).
-
Radial Length: The farther a "spoke" or petal extends from the center, the higher the percentage of time the wind came from that direction.
-
Prevailing Wind: The longest spoke on the chart immediately identifies the prevailing wind for that location.
Speed
To show intensity, each spoke is divided into colored or shaded segments.
-
The Speed Legend: Each color corresponds to a specific range of wind speeds (e.g., 0–5 mph, 5–10 mph, etc.).
-
Data Density: By looking at the colors within a single spoke, you can see if a specific direction produces mostly light breezes or dangerous, high-velocity gusts.
Scale
The scale provides the numerical framework for the entire diagram.
-
Percent Frequency Rings: These are the concentric circles radiating from the center. They are labeled with percentages (e.g., 5%, 10%, 15%).
-
Function: The scale allows you to measure the exact length of each spoke to determine the precise percentage of time the wind was active in that sector.
-
The Calm Center: The scale often starts at a center circle that displays the "Calm" percentage—the total time there was no measurable wind.
Components of a wind rose
How To Read A Wind Rose?
A wind rose provides a comprehensive visual summary of wind behavior at a specific site, mapping both direction and velocity over time.
Here is a step-by-step guide on how to read a wind rose diagram.
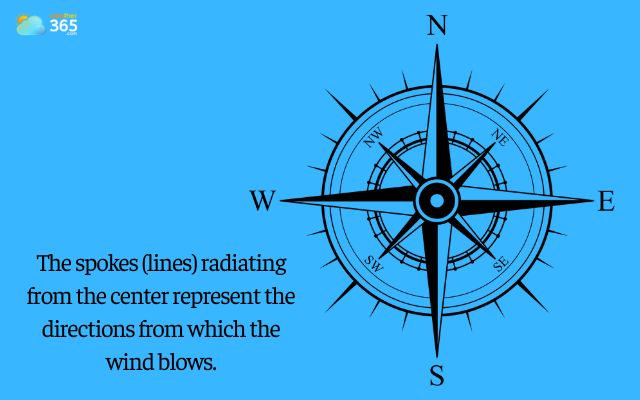
Identify the Wind Direction
The spokes (lines) radiating from the center represent the directions from which the wind blows.
Typical directions include:
-
N – North
-
NE – Northeast
-
E – East
-
SE – Southeast
-
S – South
-
SW – Southwest
-
W – West
-
NW – Northwest
Important rule: A wind rose shows where the wind comes from, not where it goes.
Example:
If the longest bar points west, it means winds most often come from the west.
A wind rose shows where the wind comes from
Look at the Frequency
The length of each bar indicates how often the wind blows from that direction.
-
Longer bars = more frequent wind
-
Shorter bars = less frequent wind
Wind frequency is usually shown as a percentage (%).
Example:
-
A bar reaching 20% means the wind blew from that direction 20% of the time.
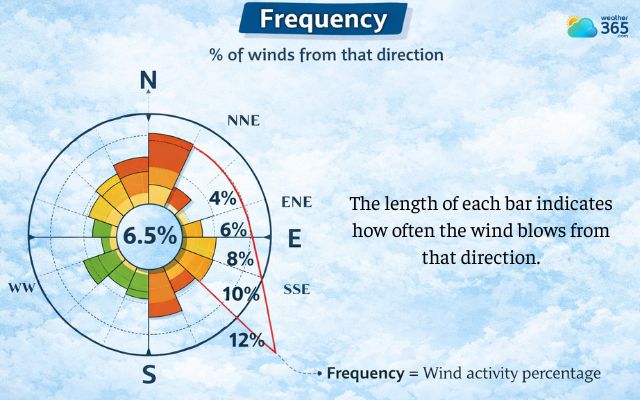
Frequency indicates how often the wind blows from that direction
Check the wind speed
Each spoke is usually divided into colored segments, which represent different wind speed ranges.
Example legend:
|
Color |
Wind Speed |
|
Light green |
0–5 m/s |
|
Yellow |
5–10 m/s |
|
Orange |
10–15 m/s |
|
Red |
15+ m/s |
If a bar has multiple colors, it means different wind speeds occurred from that direction.
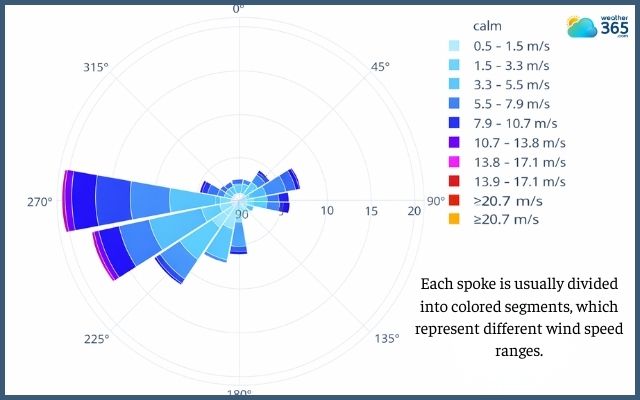
Check the color segments to know the wind speeds that occurred from that direction
Read the Circular Scale
The rings around the center show the percentage scale.
Example rings:
-
5%
-
10%
-
15%
-
20%
They help you estimate how frequent winds from a direction are.
Check Calm Conditions
Some wind roses include a “calm” percentage in the center or legend.
Example:
-
Calm: 6%
This means 6% of the time there was little or no wind.
If you are still confused of how to read a wind rose. Keep reading this example below!
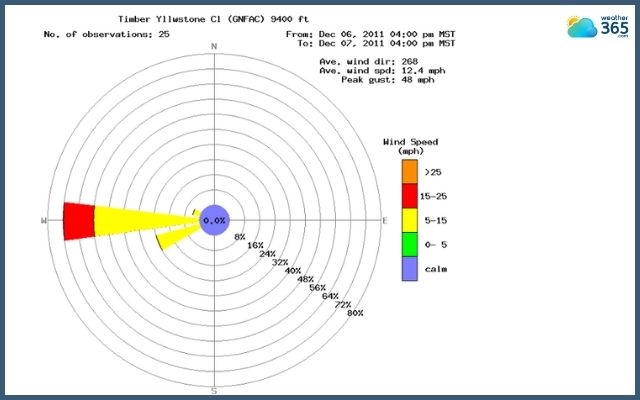
Example of a wind rose from Dec 6th -7th from the Timber Weather Station
The chart displays 25 hours of wind data, with the date and time shown in the upper-right corner. A summary on the right also lists the average wind direction, average wind speed, and peak gust.
Winds came from the west (W) 72% of the time and from the west-southwest (WSW) 24% of the time.
The red section (15–25 mph) lies between 72% and 56%, meaning winds from the west at 15–25 mph occurred 16% of the time.
The circle in the center represents calm winds. Here, calm conditions occurred 0% of the time.
Common mistakes to avoid
-
Overlooking calm conditions: Periods with very weak winds (below 1 m/s) should be treated separately because calm air can strongly influence pollutant buildup and air quality.
-
Confusing wind direction: A wind rose shows the direction the wind originates from, not the direction it moves toward. Beginners often misread this and interpret the directions the wrong way.
-
Using limited datasets: Wind data collected over a short time span can lead to inaccurate conclusions. Longer observation periods generally provide more reliable wind pattern analysis.
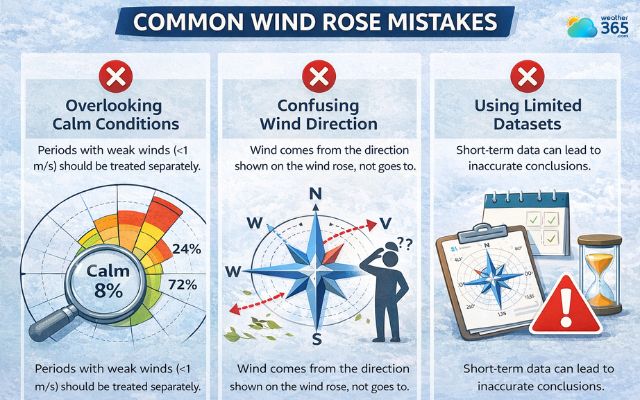
Common mistake when reading a wind rose
Read more:
Where Wind Roses Are Used?
Wind roses are widely used to analyze wind direction and wind speed patterns at a specific location.
They help scientists, engineers, and planners understand how wind behaves over time.
Below are some common applications.
Weather and Climate Studies
Meteorologists use wind roses to analyze prevailing winds and understand local climate patterns. This helps improve weather forecasting and climate research.
Air Pollution and Environmental Monitoring
Wind roses help identify how pollutants spread in the atmosphere. By knowing the prevailing wind direction, researchers can determine where pollution originates and which areas may be affected.

By reading a wind rose, we can determine where pollution originates
Wind Energy Planning
Wind energy developers use wind roses to choose the best locations for wind turbines. Areas with strong and frequent winds from consistent directions are ideal for wind power generation.
Aviation and Airport Design
Airports analyze wind roses to determine runway orientation. Runways are usually aligned with prevailing winds to improve aircraft safety during takeoff and landing.
Urban and Building Planning
Architects and city planners use wind roses to design buildings and city layouts that improve ventilation, reduce wind tunnels, and enhance comfort in urban areas.

Architects and city planners use wind roses design buildings and city layouts
Marine and Coastal Operations
In coastal regions, wind roses help with navigation, port planning, and offshore operations by showing typical wind conditions at sea.
Where To Find A Wind Rose?
You can find wind rose data through several specialized climate and meteorological platforms.
Depending on whether you need a quick visual for a specific city or high-resolution data for a professional project, here are the most reliable sources:
-
Global Wind Atlas: This is the gold standard for high-resolution wind data anywhere in the world. It provides interactive wind roses at different heights (e.g., 10m, 50m, 100m), which is essential for wind energy and tall building design.
-
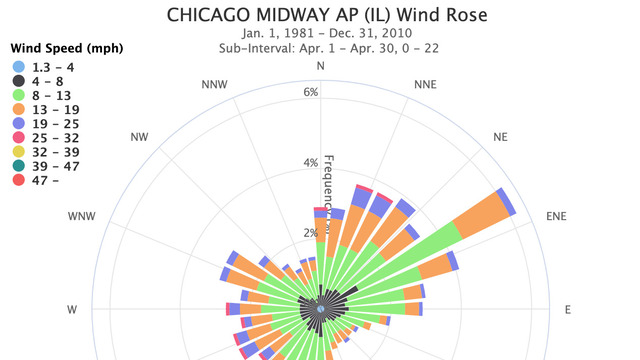
Iowa Environmental Mesonet (IEM): A fantastic free resource that generates wind roses from thousands of airports globally. It allows you to select a specific "Network" (like a country or a US state) and then choose an airport station to view its historical wind patterns.
-
Meteoblue: Offers detailed "History+" weather simulations. You can find modeled wind roses for almost any coordinate on Earth—including remote areas in Vietnam—dating back over 40 years.
-
NOAA (National Centers for Environmental Information): If you are looking for U.S. data, NOAA provides "Local Climatological Data" (LCD). You can use their cli-MATE tool to generate custom wind roses for specific time frames.
-
NRCS (Natural Resources Conservation Service): Provides a large dataset of static wind rose images (GIF format) for various U.S. cities, often used for agricultural planning.
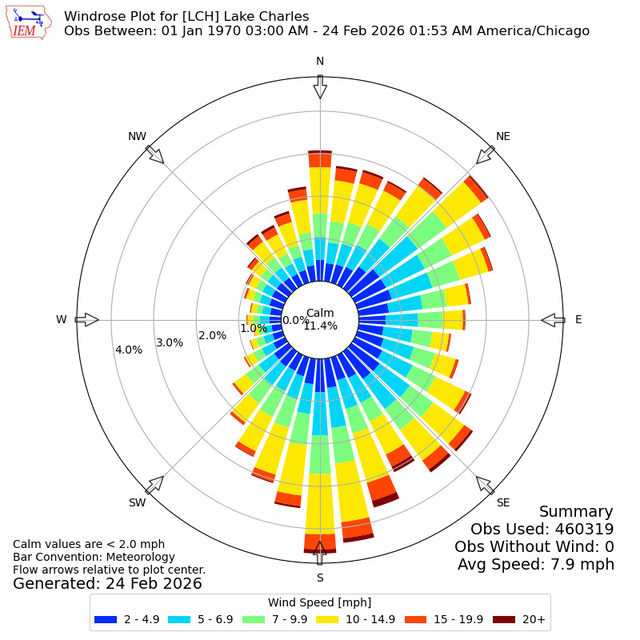
Wind rose plot for Lake Charles (Source: IEM)
Limitations of Wind Roses
While wind roses provide a valuable snapshot of wind behavior, they possess several inherent technical limitations that can impact high-stakes engineering and aviation planning:
-
Lack of Temporal Data:
A wind rose shows how often wind blows from a direction, but not when.
It cannot distinguish between a steady breeze that lasts all day and a violent gust that occurs for only ten minutes, masking the time-of-day patterns (like sea breezes) that are vital for operations.
-
No Sequence of Events:
The diagram lacks "chronological flow."
It cannot illustrate how a storm front moves through—for example, showing the wind shifting from South to Northwest over several hours.
This makes it a poor tool for predicting immediate weather transitions.
-
Locational Specificity:
Wind roses are highly sensitive to the exact placement of the sensors.
A wind rose from an airport five miles away may be completely irrelevant to a construction site tucked between skyscrapers or at the base of a mountain, given local "microclimates."
Wind roses are highly sensitive to the exact placement of the sensors
-
Data Aggregation Issues:
By grouping data into broad sectors (e.g., 22.5-degree slices), the wind rose smooths out nuances.
This "averaging" can hide critical, narrow-angle wind spikes that might be dangerous for specific runway alignments or bridge stability.
-
Ignoring Wind Shear and Altitude:
Most standard roses represent surface winds (usually at 10 meters).
They do not account for wind shear—the change in wind speed or direction at higher altitudes—which is a primary safety concern for pilots during climb and descent.
-
Calm Wind Representation:
Because "calm" air has no direction, it is removed from the directional spokes and placed in the center.
In areas with high percentages of calm air, the directional petals can look deceptively large or significant, even if the wind only blows for a small fraction of the time.
In areas with high percentages of calm air, the directional petals can look deceptively large or significant
Final Thought
You’ve got detailed information about wind roses. Hope through this post, you understand what it is as well as how to read a wind rose clearly. Follow Weather365 to know more interesting things relating to weather.
Frequently Asked Questions (FAQs)
While a standard wind rose (Type 1) aggregates all data into one image, a Type 2 analysis breaks it down to reveal cyclical patterns, such as sea breezes or mountain-valley winds that shift between day and night.
Related post

How To Measure Wind Speed: Step-by-Step Guide for Accurate Measurement

Wind Speed And Direction Explained: What Are They And How Are They Measured?

0 Comment
Leave a comment
Your email address will not be published. Required fields are marked *