




How is air quality measured? Reduction tips you should know


Ever wondered how is air quality measured? Governments and scientists use the Air Quality Index (AQI) to track pollutants and protect public health. Understanding this measurement system is essential for checking daily safety levels, managing respiratory conditions, and tracking environmental changes in your local community. This guide explains how AQI works, what pollutants are tracked, and how to reduce air pollution.
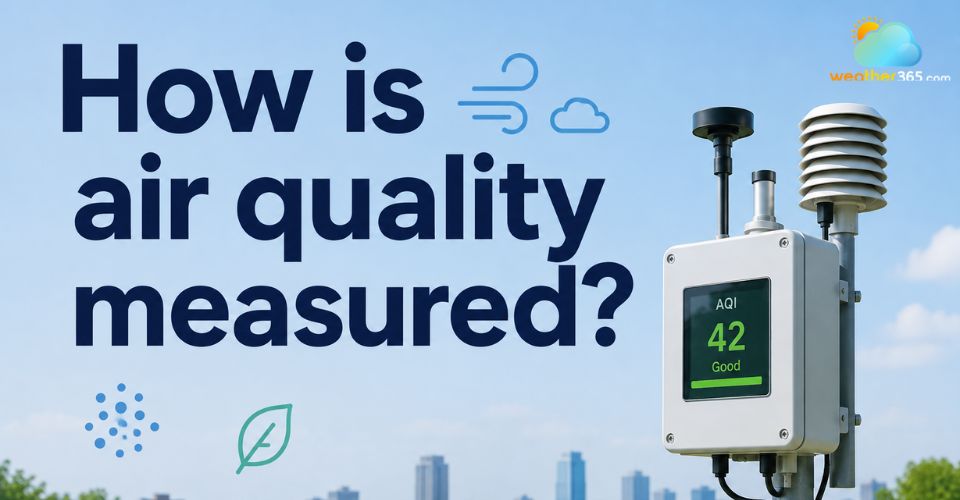
Explore how air quality is measured
- How is air quality measured?
- Key pollutants commonly measured
- Particulate Matter (PM)
- Nitrogen Dioxide (NO₂)
- Ozone (O₃)
- Sulfur Dioxide (SO₂)
- Carbon Monoxide (CO)
- Air Quality Changes By Location
- Air Quality Changes By Season
- How to reduce air pollution
- Choose Greener Ways to Travel
- Use Energy More Efficiently
- Dispose of Waste Responsibly
- Keep Indoor Air Clean
- Monitor Air Quality Reports
How is air quality measured?
The primary way air quality is measured is through the Air Quality Index (AQI). AQI is a standardized tool used by environmental agencies worldwide to report daily air quality conditions.
The AQI tells you:
How clean or polluted the air is
Whether pollution levels may affect your health
Which groups are most vulnerable
When air quality alerts should be issued
Air quality monitoring stations collect data from sensors that measure the concentration of harmful pollutants in the atmosphere.
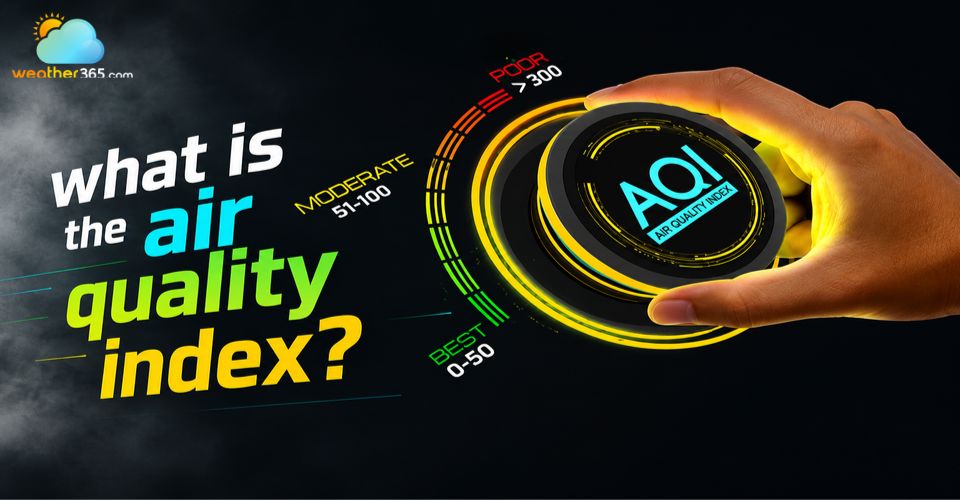
These measurements are then converted into AQI values ranging from 0 to 500.
The higher the AQI value, the greater the level of pollution and the potential health risk.
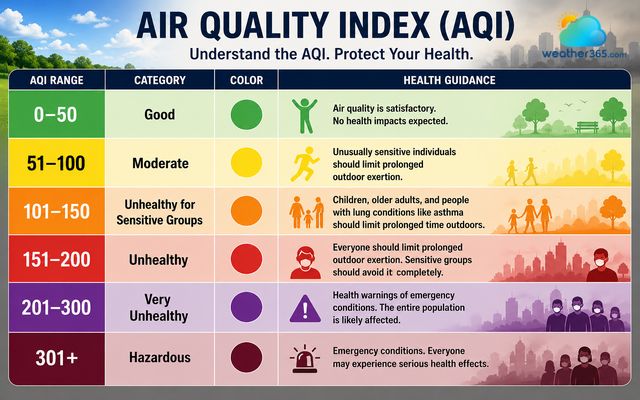
The air quality index ( AQI) range
For example, an AQI of 45 indicates good air quality, while an AQI above 300 signals hazardous conditions that require immediate precautions.
Many cities now provide real-time AQI readings through weather apps, government websites, and environmental monitoring platforms.
Key pollutants commonly measured
To understand how is air quality measured, it is important to know which pollutants are monitored.
Particulate Matter (PM)
Particulate matter refers to tiny airborne particles and droplets that are small enough to remain suspended in the atmosphere for extended periods.
Air quality monitoring focuses on two key particle sizes:
Pollutant | Size |
PM10 | Smaller than 10 micrometers |
PM2.5 | Smaller than 2.5 micrometers |
PM2.5 is especially dangerous because these ultra-fine particles can bypass the body's natural defenses, reaching deep lung tissue and potentially entering the circulatory system.
Common sources include:
Vehicle emissions
Wildfire smoke
Industrial pollution
Construction dust
According to health experts, PM2.5 is one of the most harmful pollutants linked to respiratory and cardiovascular disease.
Nitrogen Dioxide (NO₂)
Nitrogen dioxide is a gas produced primarily by fuel combustion.
Major sources include:
Cars and trucks
Power plants
Industrial facilities
Gas-powered equipment
High levels of NO₂ can irritate airways and increase the risk of respiratory infections, particularly in children and people with asthma.
Ozone (O₃)
Ground-level ozone is one of the most closely monitored air pollutants because it can have significant impacts on human health.
Unlike the ozone layer high in the atmosphere that shields Earth from harmful UV radiation, ground-level ozone forms near the surface and can irritate the lungs and airways.
It is created when pollutants from vehicles, power plants, and industrial sources react with sunlight, especially on hot and sunny days.
Key contributors include:
Vehicle emissions
Industrial emissions
Volatile organic compounds
For more information, see our guide on what is ground level ozone.
High ozone levels are especially common during hot summer days and can trigger air quality alerts.
Sulfur Dioxide (SO₂)
Sulfur dioxide is a harmful gas released when fossil fuels containing sulfur, such as coal and oil, are burned.
It is commonly associated with industrial activities and energy production.
Major sources include:
Power plants
Refineries
Industrial facilities
Exposure to sulfur dioxide may cause:
Coughing
Wheezing
Shortness of breath
Aggravated asthma symptoms
People with asthma, COPD, and other respiratory conditions are often the first to experience symptoms when sulfur dioxide levels rise.
Carbon Monoxide (CO)
Carbon monoxide is a colorless and odorless gas produced by incomplete combustion.
Common sources include:
Motor vehicles
Gas appliances
Industrial processes
Wildfires
At high concentrations, carbon monoxide reduces the blood's ability to carry oxygen, which can cause serious health problems.
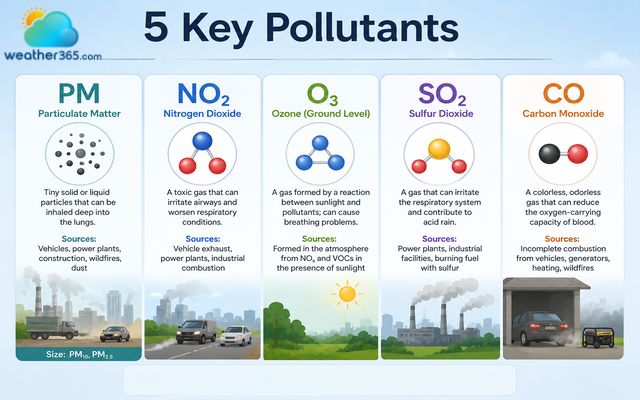
5 key pollutant commonly measured
Air Quality Changes By Location
Air quality can vary significantly from one location to another.
Urban areas often experience higher pollution levels due to heavy traffic, industrial activity, construction, and greater energy use.
Rural areas generally have cleaner air, but pollution can travel long distances.
For example, wildfire smoke from California has raised AQI levels above 150 in cities thousands of miles away.
Indoor air quality can also differ from outdoor air. Common indoor pollution sources include:
Cooking emissions
Cleaning products
Wood-burning stoves
Poor ventilation
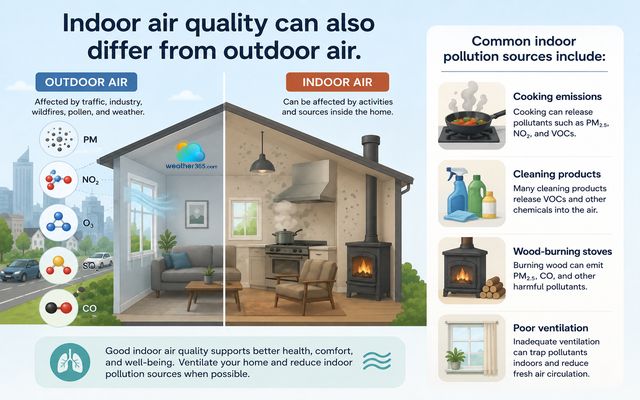
Common indoor pollution sources
Because air quality changes by location, checking local AQI reports through tools like AirNow or Weather365 can help you stay informed and protect your health.
Checking Kansas current air quality is a great way to monitor sudden smog or haze spikes before heading out!
Air Quality Changes By Season
Air quality changes throughout the year due to weather conditions and seasonal pollution sources.
Monitoring data collected between 2022 and 2024 found that air quality is generally better during spring and fall, when PM2.5 levels are lower and AQI values are often classified as "Good."
During summer, air quality can worsen because of wildfire smoke and increased ground-level ozone formation.
These pollutants often cause AQI levels to rise into the "Moderate" or even "Unhealthy" range.
Winter also tends to have higher pollution levels.
Wood-burning stoves, fireplaces, and home heating systems release fine particles into the air, while temperature inversions can trap pollution near the ground.
People with asthma or other respiratory conditions may experience more symptoms during summer and winter when air quality is poorer.
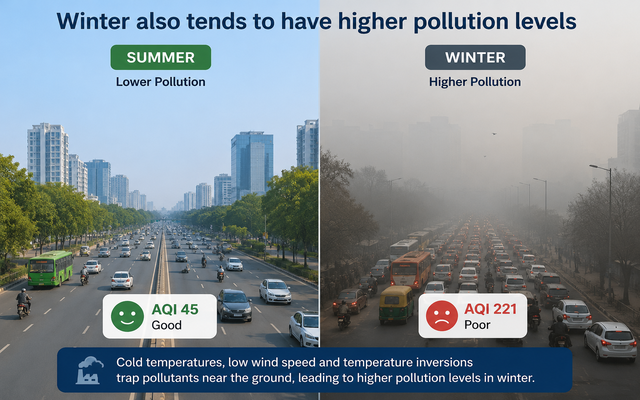
Winter tend to have higher AQI than summer
Staying updated with the live California air quality also helps you prepare for seasonal shifts in fine particle pollution.
How to reduce air pollution
Improving air quality is not solely the responsibility of governments and industries. Individual actions can also make a significant impact.
By making smarter choices at home and on the road, you can help reduce pollution levels while protecting your own health.
Choose Greener Ways to Travel
Vehicle emissions are a major source of air pollution, especially in urban areas.
Reducing the number of cars on the road can lower emissions of harmful pollutants such as PM2.5, nitrogen dioxide, and carbon monoxide.
Consider these alternatives:
Walk or bike for short-distance trips
Use buses, trains, or other public transit options
Share rides with family, friends, or coworkers
Switch to hybrid or electric vehicles when possible
Plan multiple errands in one journey

Choose green transportation to reduce air pollution
Use Energy More Efficiently
Many power plants still rely on fossil fuels, which release pollutants into the atmosphere. Reducing household energy consumption can help lower demand for these facilities.
Easy energy-saving habits include:
Turning off unused lights and electronics
Using LED lighting
Choosing energy-efficient appliances
Improving home insulation
Setting thermostats wisely
Dispose of Waste Responsibly
Open burning of leaves, wood, and household waste releases smoke and fine particles that can worsen local air quality.

Burning waste resources can lead to air pollution
Healthier alternatives include:
Composting yard waste
Recycling paper, plastic, and metal
Following local waste management programs
Keep Indoor Air Clean
Because people spend most of their time indoors, indoor air quality is just as important as outdoor air quality.
To create a healthier indoor environment:
Use HEPA-filter air purifiers
Ventilate rooms regularly when outdoor air is clean
Avoid smoking indoors
Use kitchen exhaust fans while cooking
Limit products that contain strong chemicals or VOCs
Change HVAC filters on schedule
Monitor Air Quality Reports
Checking daily AQI forecasts can help you plan activities and reduce exposure during high-pollution days.
Whether you need to see the Miami, FL air quality report for beach outings, review the Colorado hourly AQI conditions before a mountain hike, or check Dallas, TX weather and AQI ahead of your workday, staying proactive is essential.
This is especially important for people who experience symptoms of poor air quality, including:
Coughing
Wheezing
Eye irritation
Headaches
Shortness of breath
Fatigue
When AQI levels are unhealthy, consider staying indoors, reducing outdoor exercise, and wearing a high-quality mask if you must spend extended time outside.
By combining personal actions with community-wide efforts, everyone can contribute to cleaner air and a healthier environment.
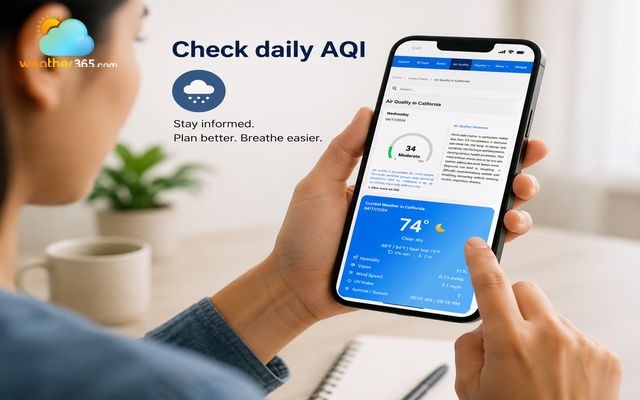
Check daily AQI
Key takeaway
Air quality monitoring plays a vital role in protecting public health by identifying pollution levels and potential risks before they become serious. Understanding pollutants, AQI categories, and local air quality conditions can help you make informed decisions and reduce exposure to harmful contaminants. By learning how is air quality measured, you can better understand air pollution reports and take steps to protect your health every day.
Frequently Asked Questions (FAQs)
Related post
What Is the Air Quality Index? Understanding AQI Levels and Health Risks
 220
220
 8
8
 4.9
4.9
 09/09/2026
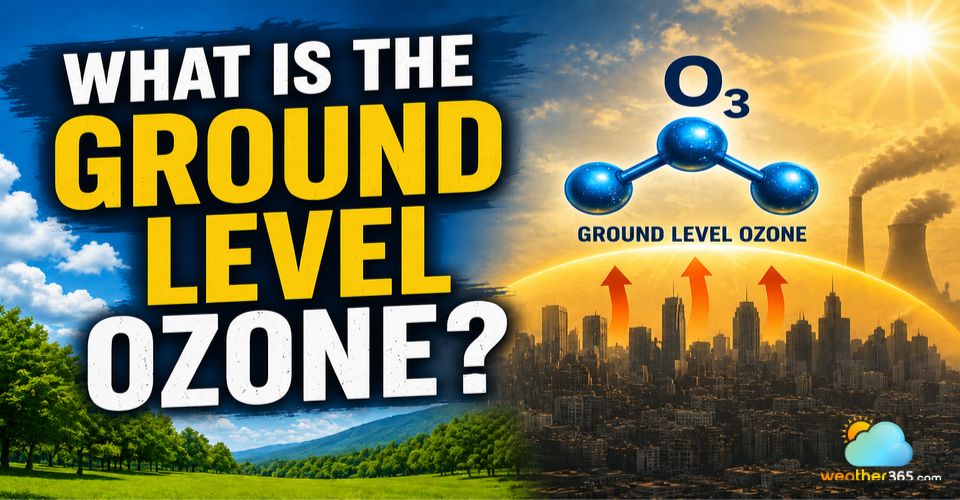
What is ground level ozone? Understanding ozone pollution and your health
185
8
4.8
17/09/2026
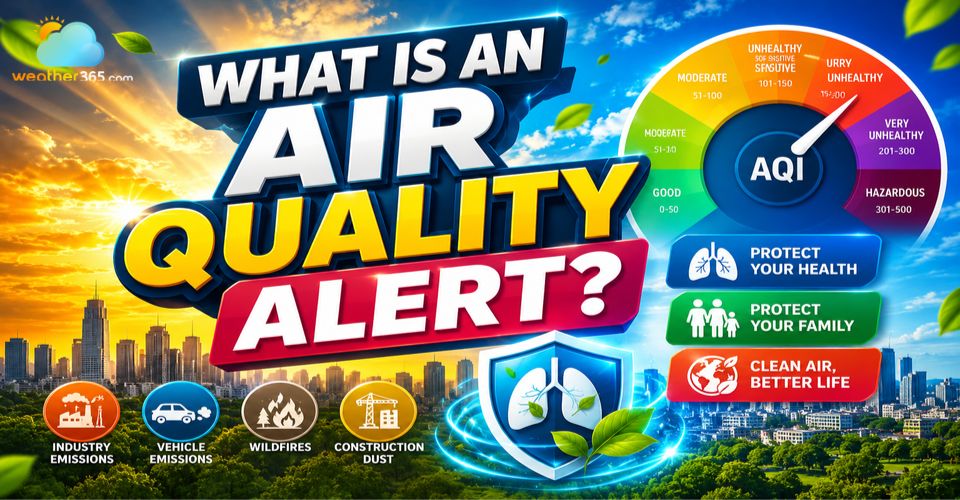
What Is an Air Quality Alert? A Complete Guide to AQI Warnings
56
8
4.8
17/09/2026

8 Comment
Hudson Carter
One thing I appreciate about air-quality monitoring is that it gives us information we can’t get just by looking outside. Clear skies definitely don’t tell the whole story.
Wesley Mills
I used to think an air-quality number was just another automated reading. Now it feels more like the end result of a whole monitoring system working quietly in the background
Theo Smith
Why are measurements from official monitoring stations generally more reliable than a single personal sensor?
weather365
Official networks typically use standardized equipment, calibration procedures, and quality-control methods to produce consistent measurements that can be compared across locations and time.
Marshall Brown
Can air quality measurements change even when there are no new pollution sources nearby?
weather365
Yes. Wind can transport pollutants from elsewhere, while changes in temperature and atmospheric conditions can affect how pollutants accumulate or disperse.
Jonathan Douglas
Why do air quality monitoring stations need to be placed in different locations?
weather365
Pollution levels can vary significantly depending on traffic, industry, terrain, weather, and other local conditions, so one station cannot represent an entire region accurately.
Leave a comment
Your email address will not be published. Required fields are marked *