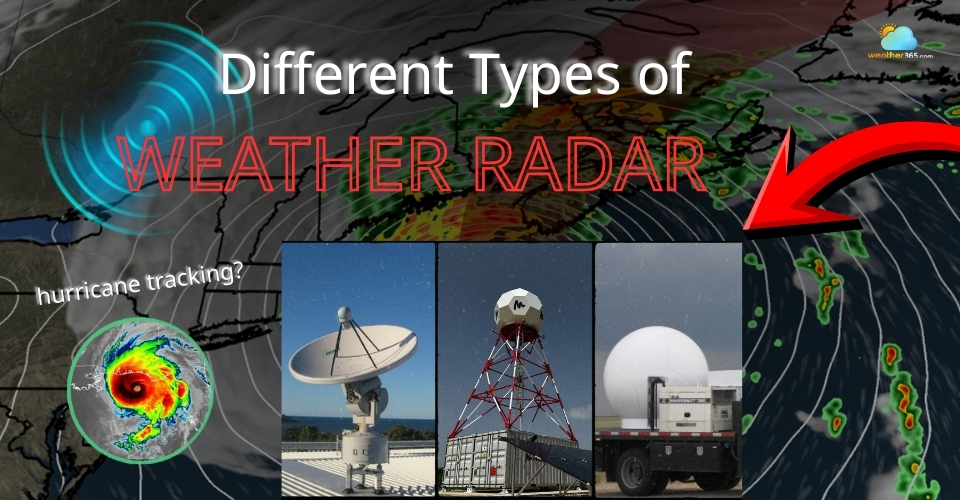
Different Types Of Weather Radar: How Different Radar Systems Track Weather
Types of weather radar determine how meteorologists detect storms, measure rainfall, and track dangerous weather systems. Yet most people never realize that radar maps come from different technologies. Let’s discover the different radar types and how they help meteorologists track storms more accurately.
What are the types of weather radar?
- What is A Weather Radar?
- Main Types of Weather Radar
- By Frequency Band
- By Technology
- By Data Product
- How Does Weather Radar Work?
- Benefits and Limitations of Radar Technology
- Benefits
- Limitations
- How To Read Weather Radar?
- Step 1: Understand the Radar Color Scale
- Step 2: Identify Where Precipitation Is Occurring
- Step 3: Watch the Movement of the Radar
- Step 4: Look at Storm Shape and Structure
What is A Weather Radar?
A weather radar is a scientific instrument used to detect and monitor precipitation in the atmosphere.
The word radar actually stands for Radio Detection and Ranging.
In simple terms, it means using radio waves to locate objects and measure their distance.
When applied to meteorology, this technology becomes an extremely powerful tool for observing weather systems in real time.
Instead of relying only on ground stations or satellite images, meteorologists can see the structure and movement of storms as they develop.
Weather radar is a tool to detect and monitor precipitation
At the heart of a weather radar system is a rotating antenna that continuously scans the sky.
The radar emits short bursts of microwave energy in many directions.
When these waves encounter precipitation particles in the atmosphere, part of the energy is reflected back toward the radar receiver.
By measuring how long it takes for the signal to return, the system can calculate the distance to the precipitation.
The strength of the returned signal also reveals how heavy the precipitation may be.
This information is then processed by computers and displayed as radar images or weather maps.
These maps often use different colors to represent varying levels of precipitation intensity, allowing meteorologists and weather apps to visualize storms quickly.
For example, light rain may appear in green, while heavier rainfall or thunderstorms may show up in yellow, red, or even purple.
Main Types of Weather Radar
In meteorology, radar technology can actually be classified in several different ways.
This classification depends on how the radar signal is transmitted, how the system measures atmospheric motion, and what type of data it produces.
By Frequency Band
One of the most common ways to classify types of weather radar is by the frequency band it uses.
The frequency of a radar wave determines how far the signal can travel and how it interacts with precipitation particles in the atmosphere.
Different frequencies produce different wavelengths.
Longer wavelengths tend to travel farther and are less affected by heavy rainfall, while shorter wavelengths provide more detailed observations but may weaken quickly during intense precipitation.
S-band
S-band radar uses relatively long wavelengths and is widely used in national weather radar networks.
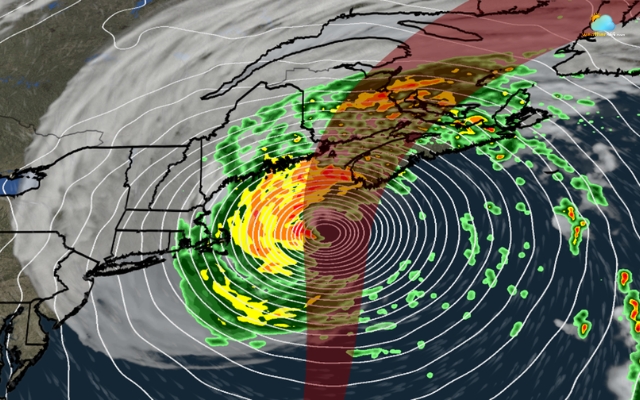
Because the signal is less affected by heavy rain, this type of radar is particularly useful for tracking large storm systems such as hurricanes and severe thunderstorms.
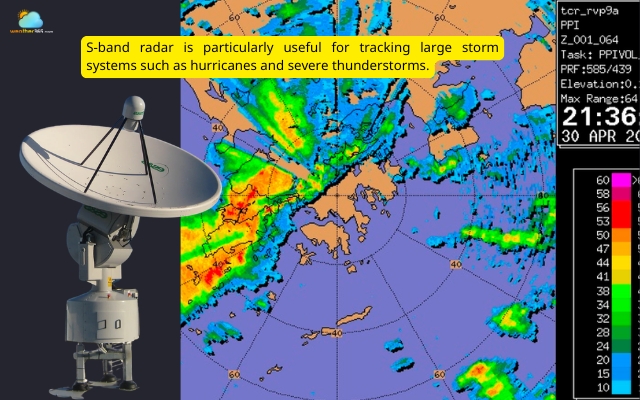
S-band radar is used in national weather radar networks
C-band
C-band radar operates at a slightly higher frequency and shorter wavelength.
It offers a good balance between coverage range and image resolution, which is why many regional weather services rely on it for everyday precipitation monitoring.
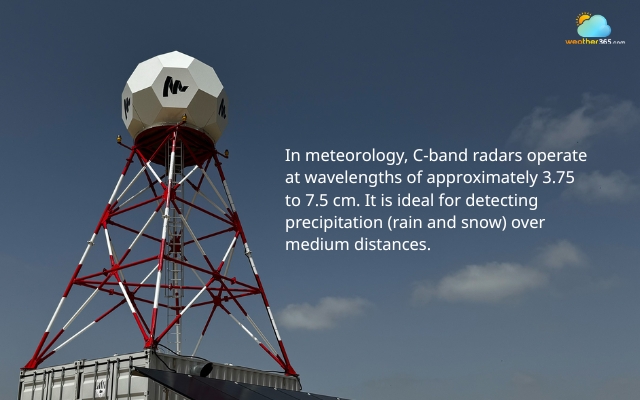
C-band is often used for daily precipitation monitoring
X-band
X-band radar uses even shorter wavelengths.
These systems can produce highly detailed radar images and are often used for local weather monitoring, research projects, and urban storm observation.
However, heavy rainfall can weaken the signal more easily compared to longer-wavelength radar systems.
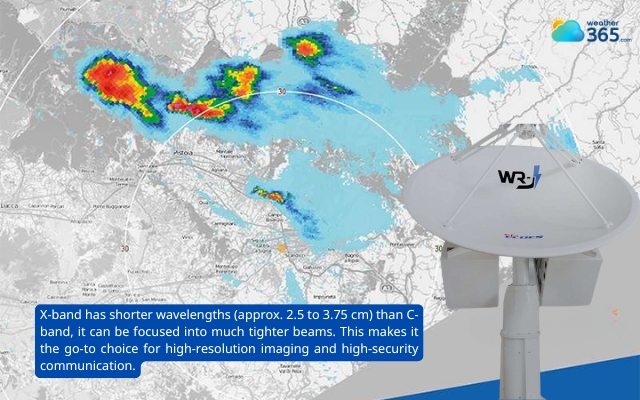
X-band uses short wavelengths
K-band
At even higher frequencies, K-band radar may be used in specialized scientific studies.
Because the signal is extremely sensitive to small atmospheric particles, it is often used to study clouds or very fine precipitation rather than large-scale storm systems.
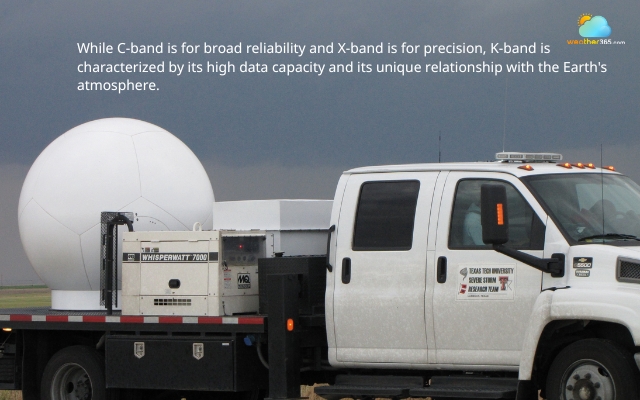
K-band is used in specialized scientific studies
By Technology
Another important way to categorize the types of weather radar is by the technology used to analyze atmospheric motion and precipitation.
Over the years, radar systems have evolved significantly, allowing meteorologists to observe storms in much greater detail than earlier generations of radar could provide.
Doppler radar
One of the most well-known radar technologies is Doppler radar.
This system measures the motion of precipitation particles by detecting changes in the frequency of the returned radar signal.
Thanks to this capability, meteorologists can see whether rain or hail is moving toward or away from the radar.
This information helps reveal wind patterns inside storms and can even identify rotation that may lead to tornado formation.
What’s more can a doppler radar do? Check out our guide on What is a doppler weather radar!
Doppler weather radar can track wind patterns
Dual-polarization radar
Another major advancement is dual-polarization radar, often called dual-pol radar.
Unlike traditional radar systems that transmit pulses in a single orientation, dual-polarization radar sends both horizontal and vertical signals.
By comparing the returned signals, the radar can estimate the shape and type of precipitation particles.
This allows meteorologists to distinguish between rain, snow, sleet, and hail much more accurately.
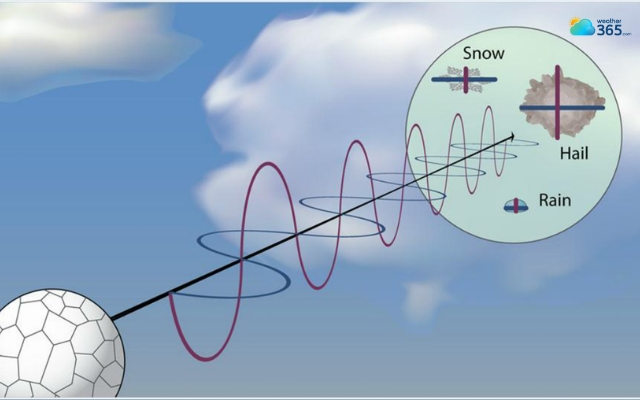
Dual-polarization radar sends both horizontal and vertical signals
Phased-array radar
A newer technology known as phased-array radar is also gaining attention in meteorological research.
Instead of physically rotating the radar antenna, this system steers radar beams electronically.
As a result, it can scan the atmosphere much faster than conventional radar systems.
Faster scanning means meteorologists can observe rapidly developing storms with greater time resolution, which is particularly useful during severe weather outbreaks.
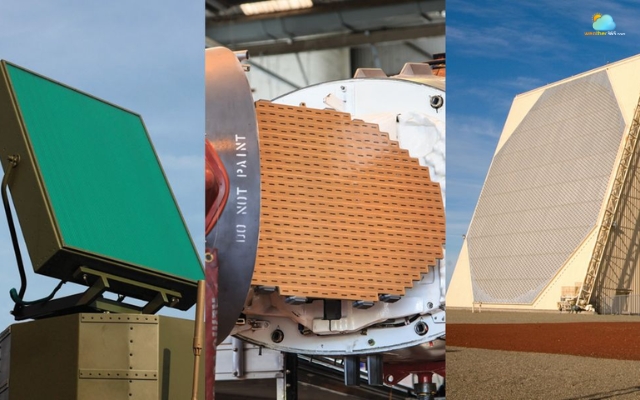
Phase-array radar steers radar beams electronically
By Data Product
Weather radar can also be classified based on the types of data products it generates.
When radar signals return to the receiver, computers process the information and convert it into different visual datasets that meteorologists analyze.
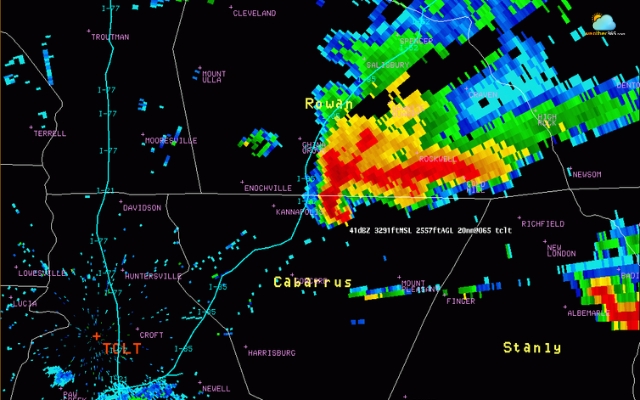
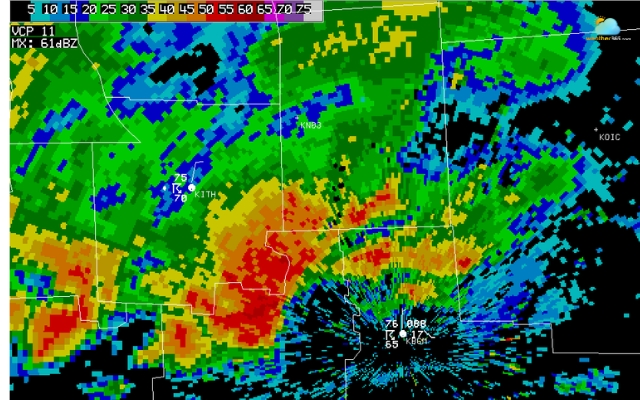
Base reflectivity
One of the most commonly used radar products is base reflectivity.
This dataset measures how strongly precipitation particles reflect radar energy.
The stronger the returned signal, the heavier the precipitation is likely to be.
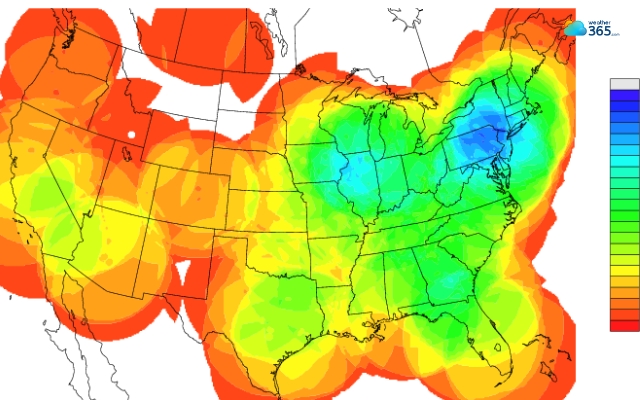
Reflectivity maps are what most people see in weather apps, where different colors represent varying rainfall intensity.
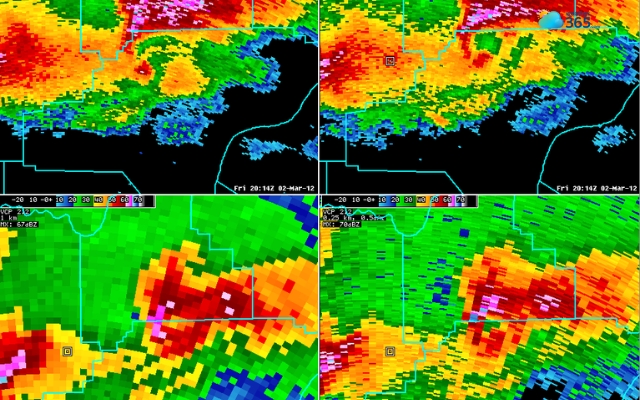
Base reflectivity measures precipitation intensity
Velocity
Another important product is velocity data.
This dataset comes from Doppler radar and shows the speed and direction that precipitation particles are moving relative to the radar.
By examining velocity patterns, meteorologists can identify wind circulation inside storms and detect areas where rotation might be occurring.
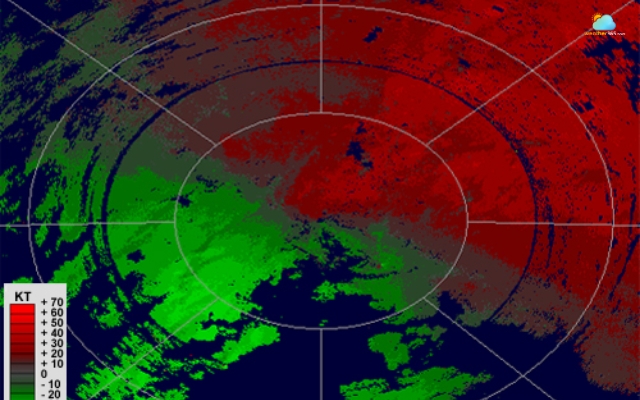
Velocity data shows the speed and direction of precipitation
Range height indicator
A more specialized radar display is the range height indicator (RHI).
Instead of showing precipitation across a horizontal map, this radar view displays a vertical cross-section of the atmosphere.
It allows meteorologists to examine how tall a storm is and how precipitation is distributed from the ground up through the cloud structure.
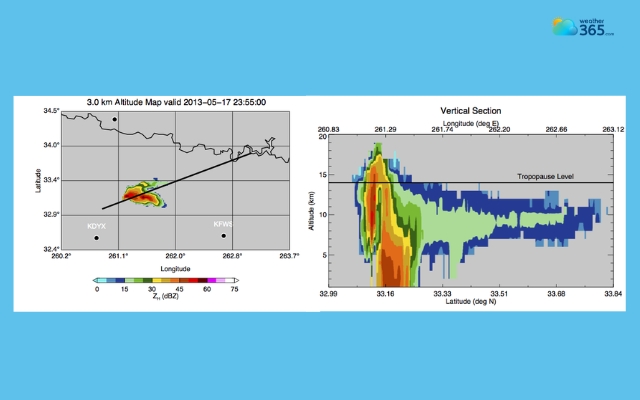
The range height indicator displays a vertical cross-section of the atmosphere
How Does Weather Radar Work?
Weather radar works by sending out radio waves and analyzing the signals that return after hitting precipitation in the atmosphere.
These signals bounce off raindrops, snowflakes, or hail, allowing meteorologists to detect where precipitation is occurring and how intense it is.
The radar system uses a rotating antenna that continuously emits short pulses of microwave energy into the sky.
When these waves encounter precipitation particles, part of the energy reflects back to the radar receiver.
By measuring how long the signal takes to return, the radar can calculate the distance to the precipitation.
The strength of the returned signal also helps estimate how heavy the rain or snow might be.
Modern weather radars scan the atmosphere at multiple angles while rotating, building a three-dimensional picture of storms.
Weather radar sends out radio waves and analyzes returning signals
Many systems can update this information every few minutes, which allows meteorologists to track storm development in near real time.
Some advanced radar systems also use Doppler technology to detect motion.
By measuring small changes in the frequency of the returned signal, the radar can estimate wind movement inside storms.
This helps forecasters identify rotating thunderstorms, strong winds, and other signs of severe weather.
Benefits and Limitations of Radar Technology
Weather radar has become one of the most important tools in modern meteorology.
By continuously scanning the atmosphere, radar systems give meteorologists a near real-time view of precipitation and storm development.
This capability has significantly improved how scientists monitor weather and warn the public about dangerous conditions.
However, like any technology, weather radar also has a few limitations that forecasters must keep in mind when interpreting radar data.
Benefits
Weather radar is one of the most valuable tools meteorologists use to monitor the atmosphere.
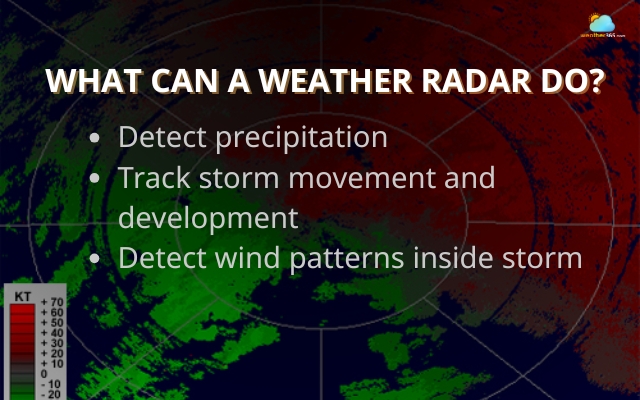
Its biggest advantage is the ability to detect precipitation over large areas in real time.
A single radar station can observe rain, snow, or storms hundreds of kilometers away, helping meteorologists quickly identify developing weather systems.
Radar is also extremely useful for tracking storm movement and intensity.
Because radar images update every few minutes, forecasters can watch storms evolve and issue warnings for severe weather such as thunderstorms, heavy rainfall, or potential flooding.
Advanced systems like Doppler radar even allow meteorologists to detect wind patterns inside storms, which helps identify rotation or strong winds.
Weather radar is the most valuable tool for meteorologists
Limitations
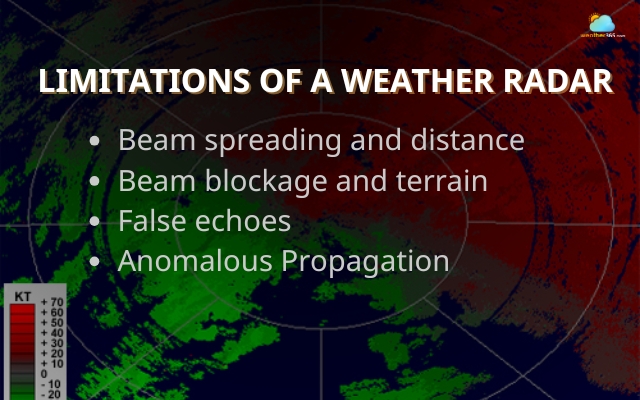
However, radar technology also has some limitations.
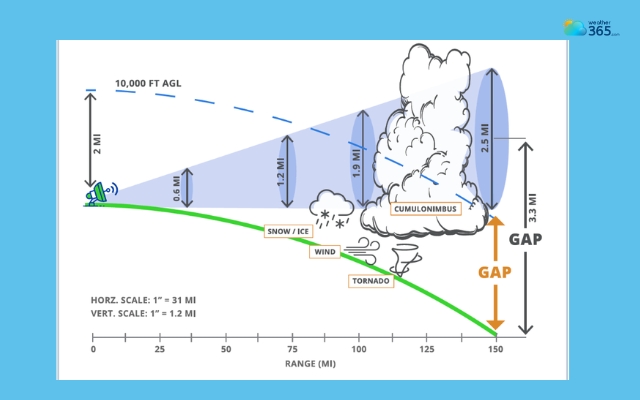
One challenge is that the radar beam gradually rises higher above the ground as it moves farther from the station.
This means precipitation close to the surface may sometimes be missed at long distances.
Radar signals can also be blocked or distorted by mountains, buildings, or very heavy rainfall, which may reduce data accuracy.
In some cases, radar may even detect non-weather objects such as birds, insects, or dust particles.
For this reason, meteorologists usually combine radar data with other observation tools like satellites and weather stations.
Together, these systems provide a more complete and reliable picture of current weather conditions.
Weather radar also has some drawbacks
How To Read Weather Radar?
Reading a weather radar map becomes much easier when you break the process into a few simple steps.
Paying attention to colors, movement, and storm patterns, you can quickly understand what the radar image is showing.
Step 1: Understand the Radar Color Scale
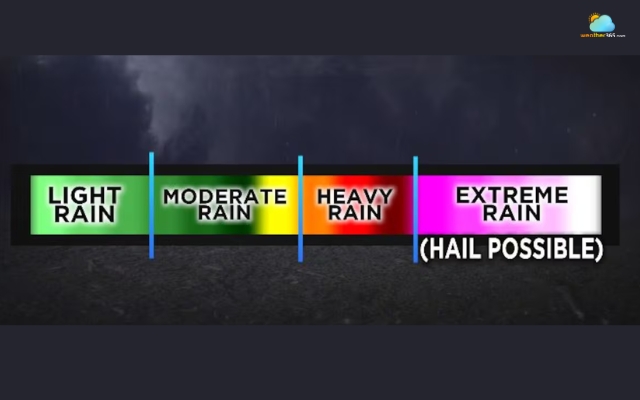
The first thing to look at is the color legend on the radar map. Different colors represent different levels of precipitation intensity.
In most radar systems, light colors such as green usually indicate light rain, while yellow and orange suggest moderate rainfall.
Darker colors like red often mean heavy rain or strong thunderstorms.
In some radar maps, purple may even indicate extremely intense precipitation or hail.
Understanding this color scale helps you quickly estimate how strong a storm might be.
Learn details about the radar color scale for reflectivity and velocity here!
Color indicators in weather radar
Step 2: Identify Where Precipitation Is Occurring
Next, observe where the colored areas appear on the map. These areas represent locations where the radar has detected precipitation.
Large, widespread patches of green often suggest steady rain over a wide region.
In contrast, smaller clusters of bright colors may indicate more intense storms developing in specific areas.
Identify the location
Step 3: Watch the Movement of the Radar
Most radar maps are shown as animations that update every few minutes.
By watching how the precipitation areas move from frame to frame, you can determine the direction and speed of a storm.
For example, if the colored areas are moving toward your location, it may mean rain or storms are approaching.
If they are moving away, the weather may soon improve.
Track the movement of the precipitation
Step 4: Look at Storm Shape and Structure
The shape of radar echoes can also reveal important information about the type of weather system.
Broad, uniform areas of precipitation usually indicate steady rain. Meanwhile, more irregular or intense clusters may signal thunderstorms.
Sometimes radar images even show curved or rotating patterns, which meteorologists may analyze to detect strong storm dynamics.
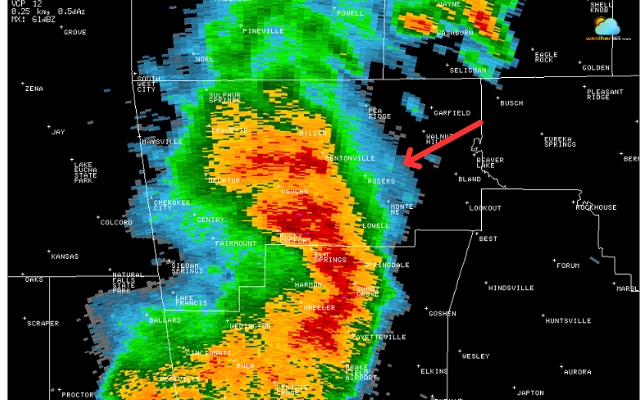
Pay attention to the storm shape
Final Thought
Types of weather radar help meteorologists see what’s happening inside storms and track precipitation in real time. Learning the basics of radar technology not only explains how forecasts work but also helps you understand the weather maps you see every day.
Frequently Asked Questions (FAQs)
Related post

The Most Accurate Weather Forecast: Unveiling the Truth

What Is The GFS Weather Model: Accuracy, Uses & Comparison Explained

0 Comment
Leave a comment
Your email address will not be published. Required fields are marked *