




Accumulated Precipitation: Definition, Applications, and Measurement


Accumulated precipitation helps explain how much rain, snow, or hail builds up over time. But how is it measured, and why does it matter for industries like agriculture and climate science? Read on to discover how accumulated precipitation works and how to interpret it accurately. Diving in!
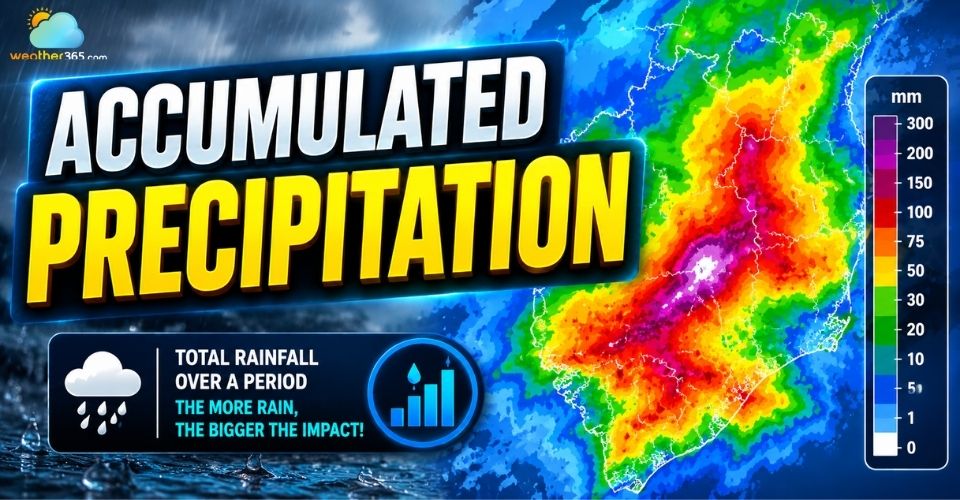
Accumulated precipitation
- What is accumulated precipitation?
- How to measure accumulated precipitation?
- Standard rain gauge
- Tipping bucket gauges
- Weighing gauges
- Manual calculation
- Practical business applications of accumulated precipitation
- Agriculture
- Hydrology and flood monitoring
- Climate studies
- Construction and infrastructure
- Transportation and logistics
- How to read accumulated precipitation?
What is accumulated precipitation?
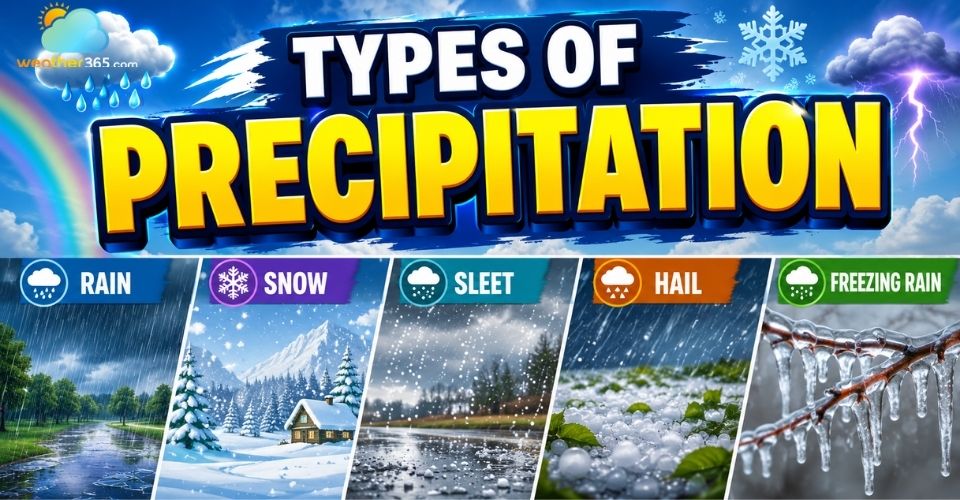
Accumulated precipitation refers to the total amount of rain, snow, sleet, or hail that falls over a specific period of time in a particular area.
These different types of precipitation are tracked cumulatively rather than at a single moment.
Meteorologists use accumulated precipitation data to understand weather patterns, monitor storms, and predict flood risks. It is commonly displayed in weather apps, forecast models, and radar maps.
For example:
If an area receives 2 mm of rain in the morning and another 8 mm in the evening, the daily accumulated precipitation is 10 mm.
If it rains 1 mm on day one, 0 mm on day two, and 5 mm on day three, the 3-day accumulated precipitation equals 6 mm.
Accumulated precipitation can include hourly/daily/weekly/monthly/ totals, or even annual precipitation accumulation.
This data is usually measured in millimeters (mm) or inches depending on the region.
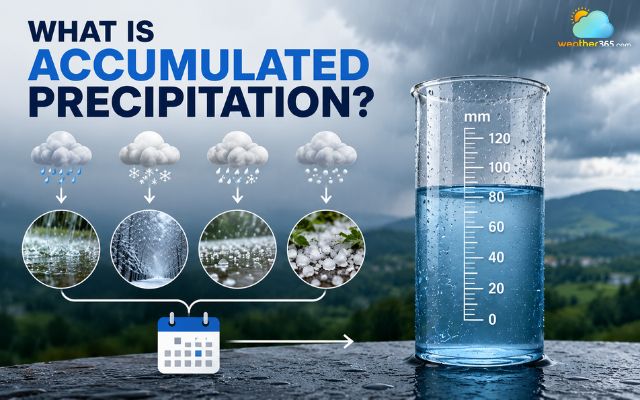
Accumulated precipitation refers to the total amount of rain
How to measure accumulated precipitation?
Accumulated precipitation is measured by summing water depth over a period using a standard rain gauge, tipping bucket gauge, weighing gauges, or even by manual calculation.
The chosen method depends on the level of accuracy required, the location, and the purpose of the measurement.
Standard rain gauge
A standard rain gauge is one of the simplest and most widely used tools for measuring precipitation.
It usually consists of a cylindrical container with a funnel on top that directs rainwater into an inner measuring tube. The collected water is measured manually at regular intervals such as daily, weekly, or monthly.
To calculate accumulated precipitation, the measured amounts are added together over the desired timeframe.
For example:
Monday: 5 mm
Tuesday: 2 mm
Wednesday: 3 mm
The accumulated precipitation over three days is 10 mm.
Standard rain gauges are commonly used at weather stations, schools, farms, and research centers because they are affordable and easy to maintain.
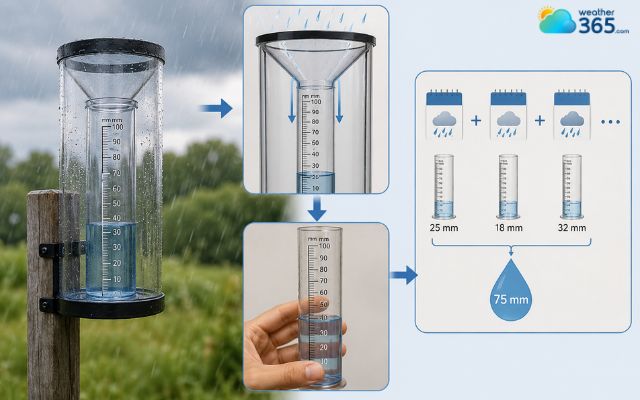
Standard rain gauges are commonly used at weather stations
Tipping bucket gauges
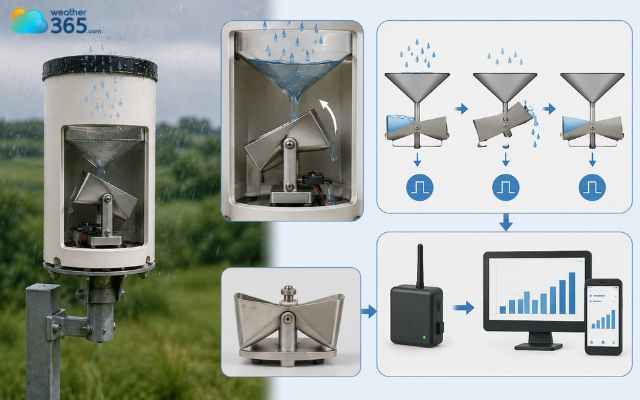
Tipping bucket rain gauges automate the measurement process.
Inside the device is a small bucket mechanism that tips whenever a specific amount of water is collected, often 0.2 mm or 0.01 inch. Each tip is recorded electronically.
The system continuously counts the number of tips and automatically calculates the total accumulated precipitation over time.
Because the data is recorded digitally, tipping bucket gauges are commonly connected to weather monitoring systems and online forecasting platforms.
These gauges are especially useful for:
Real-time weather monitoring
Flood warning systems
Airport weather stations
Smart agriculture systems
However, extremely heavy rainfall can sometimes reduce their accuracy because the tipping mechanism may not keep up with intense precipitation rates.
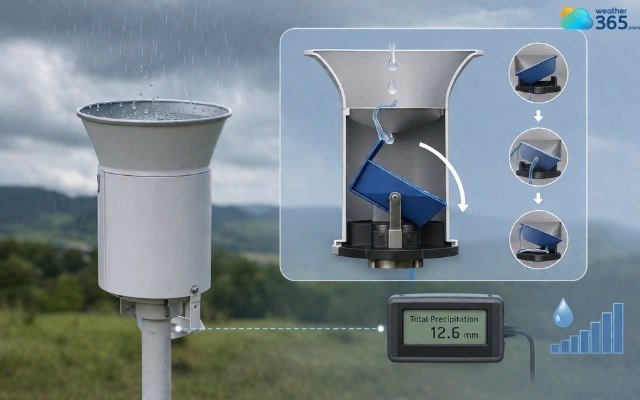
Tipping mechanism is useful for real-time weather monitoring
Weighing gauges
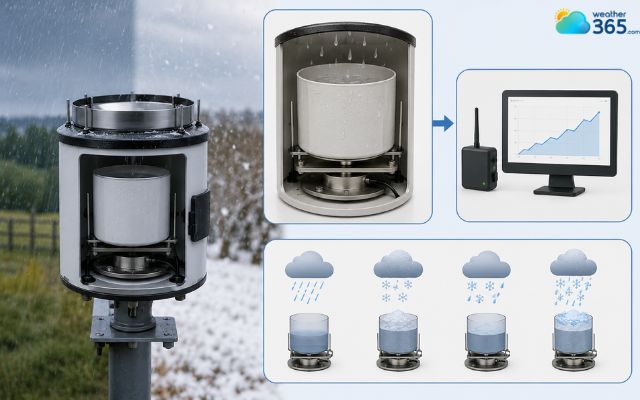
Weighing gauges are precipitation gauges that measure accumulated precipitation by continuously recording the weight of the precipitation collected in a storage container.
They are considered one of the most accurate methods for measuring accumulated precipitation.
Instead of counting rainfall volume directly, these instruments measure the increasing weight of collected precipitation in a storage container. The system then converts the weight into precipitation depth.
Weighing gauges can measure rain, snow, mixed precipitation, or long-duration accumulation.
They are particularly useful in colder climates because they can measure frozen precipitation after melting it internally.
Meteorological agencies often use weighing gauges for scientific observations and climate studies due to their high accuracy.
Weighing gauges are considered one of the most accurate methods
Manual calculation
In some situations, accumulated precipitation can also be calculated manually using recorded rainfall data.
The process is straightforward:
Step 1: Record precipitation amounts for each time period.
Step 2: Add all values together.
Step 3: The result is the total accumulation.
For example:
Day 1: 4 mm
Day 2: 6 mm
Day 3: 0 mm
Day 4: 10 mm
Total accumulated precipitation = 20 mm.
Manual calculations are often used in educational projects, agricultural records, and small-scale environmental monitoring.
Accumulated precipitation is calculated using recorded rainfall data
Practical business applications of accumulated precipitation
Accumulated precipitation data plays a major role across many industries.
Businesses and organizations rely on precipitation accumulation forecasts and historical records to improve planning, reduce risks, and make informed decisions.
Agriculture
In agriculture, accumulated precipitation helps farmers track water availability throughout the growing season.
By monitoring rainfall accumulation, farmers can:
Schedule irrigation more efficiently
Prevent overwatering
Estimate soil moisture levels
Protect crops from drought stress
Plan planting and harvesting activities
For example, prolonged low precipitation accumulation may signal drought conditions, while excessive accumulation can increase the risk of root diseases or crop flooding.
Modern farming platforms often combine precipitation forecasts with soil and temperature data to support precision agriculture practices.
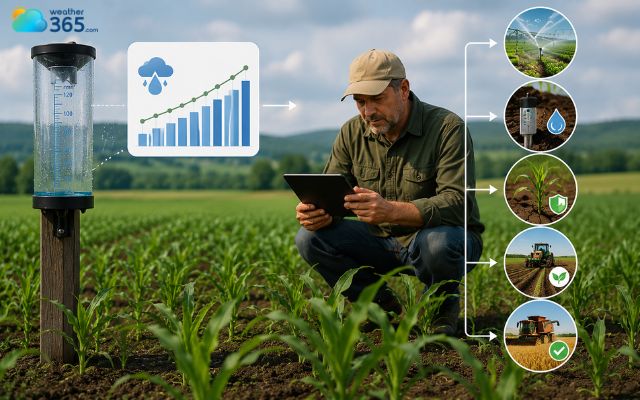
Accumulated precipitation helps farmers track water availability
Hydrology and flood monitoring
Hydrologists use accumulated precipitation data to assess flood risks and monitor river systems.
When large amounts of precipitation accumulate within a short period, rivers, lakes, and drainage systems may overflow.
Tracking seasonal rainfall accumulation helps water management boards evaluate reservoir recovery on California 30-day precipitation totals.
Weather agencies and emergency management teams use precipitation accumulation forecasts to issue flood warnings before dangerous conditions develop.
This information can support urban drainage management, reservoir operations, dam safety monitoring, or flash flood prediction.
Even moderate rainfall can become hazardous if the ground is already saturated from previous accumulated precipitation.
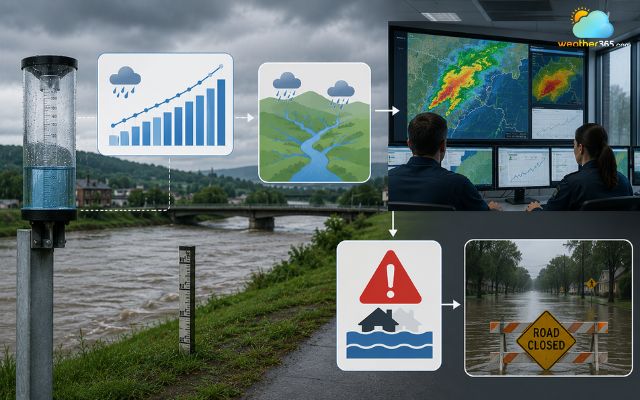
Accumulated precipitation is used to assess flood risks
Climate studies
Climate scientists analyze long-term accumulated precipitation trends to study climate variability and environmental change.
Historical precipitation accumulation records help researchers identify:
Shifts in rainfall patterns
Increasing drought frequency
Seasonal weather changes
Extreme precipitation events
Long-term climate trends
Comparing annual precipitation accumulation across decades allows scientists to better understand how global warming may be affecting regional weather systems.
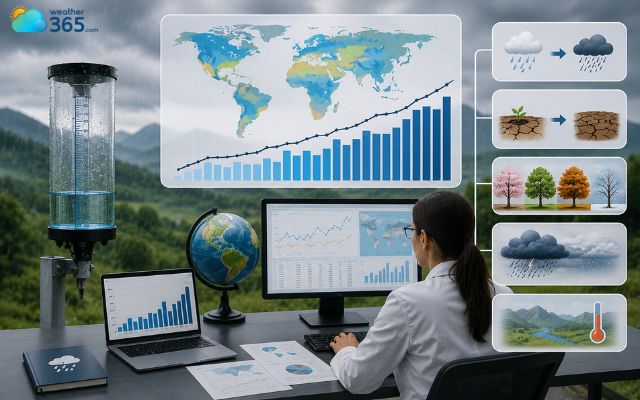
Accumulated precipitation helps predict climate variability
Construction and infrastructure
Construction companies also monitor accumulated precipitation closely.
Heavy rainfall accumulation can delay outdoor projects, damage materials, and create unsafe working conditions.
Engineers use historical precipitation data when designing roads, drainage systems, bridges, and stormwater infrastructure.
Understanding local precipitation accumulation patterns helps improve long-term infrastructure durability and flood resistance.
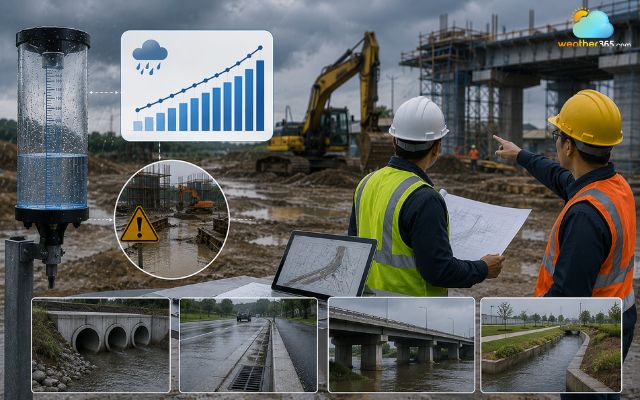
Heavy rainfall accumulation can delay outdoor projects
Transportation and logistics
Transportation companies use precipitation accumulation forecasts to prepare for weather-related disruptions.
Heavy rainfall or snow accumulation can affect flight schedules, shipping routes, highway safety, and so on.
Accurate forecasts allow businesses to adjust operations and minimize delays during severe weather events.

Heavy rainfall can affect flight schedules
How to read accumulated precipitation?
Reading accumulated precipitation data becomes easier once you understand the timeframe, measurement units, and map colors used in forecasts.
Most weather apps and forecast platforms display accumulated precipitation using maps, charts, or numerical values.
Step 1: Understand the timeframe
Always check the accumulation period first.
Accumulated precipitation maps may display totals for 1,6,24 hours, and 3,7,10 days.
A forecast showing 50 mm of accumulated precipitation over 10 days is very different from 50 mm expected within one hour.
Short-term high accumulation usually indicates stronger storms and higher flood risk.
Step 2: Check the measurement units
Accumulated precipitation is commonly shown in millimeters (mm) or inches (in).
Light rain | less than 2.5 mm per hour |
Moderate rain | 2.5–7.5 mm per hour |
Heavy rain | more than 7.5 mm per hour |
Large accumulated totals over short periods often signal severe weather conditions.
Step 3: Learn map color scales
Most precipitation maps use color gradients to represent different accumulation amounts.
Light rain | less than 2.5 mm per hour |
Moderate rain | 2.5–7.5 mm per hour |
Heavy rain | more than 7.5 mm per hour |
Step 4: Forecast vs historical accumulation
Accumulated precipitation data may represent either past recorded or future forecast precipitation.
Historical accumulation helps analyze previous weather conditions, while forecast accumulation predicts expected precipitation totals.
When reading a forecast, meteorologists often combine this data with the probability of precipitation to show how likely it is to rain.
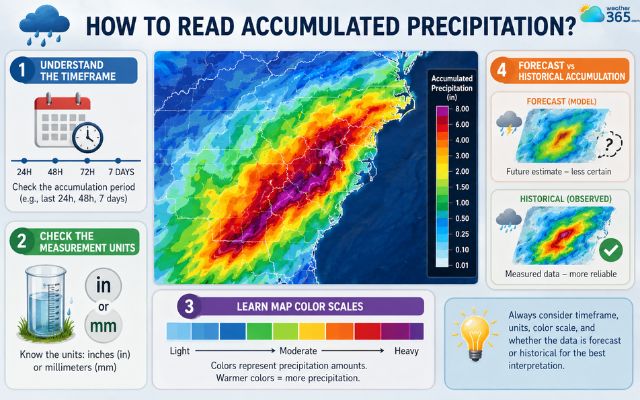
Understand the timeframe to read accumulated precipitation
Using Weather365 for accumulated precipitation tracking
Weather365 provides users with accumulated precipitation forecasts and weather tracking tools that make interpreting rainfall data much easier.
With Weather365, users can monitor:
Daily precipitation totals
Hourly rainfall forecasts
Multi-day precipitation accumulation
Weather radar trends
Local storm developments
Weather365 also allows users to compare upcoming rainfall forecasts with current weather conditions, helping individuals and businesses prepare for changing weather patterns more effectively.
For agriculture, outdoor planning, travel, and flood awareness, having access to accumulated precipitation forecasts in one place can be extremely useful.
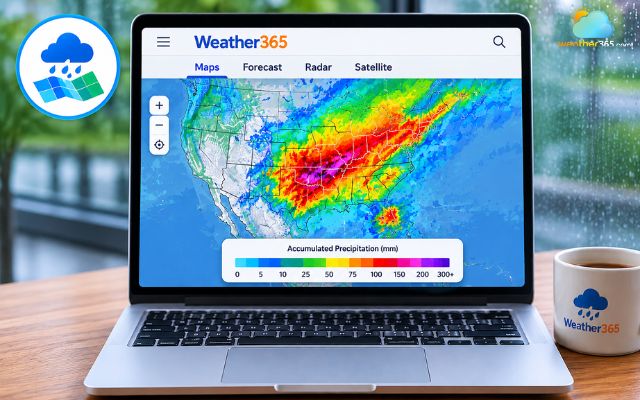
Tracking precipitation forecasts on Weather365
Closing thoughts
Accumulated precipitation is an essential weather measurement that helps people understand rainfall patterns, flood risks, and long-term climate trends. By learning how it is measured and interpreted, you can make better decisions for travel, agriculture, business planning, and daily life while reading weather forecasts with greater confidence.
Frequently Asked Questions (FAQs)
Related post
Types of Precipitation: Definition, Examples, and Weather Impact
 175
175
 10
10
 4.8
4.8
 19/08/2026

8 Comment
Lucia Edwards
Can accumulated precipitation forecasts be used to decide when to water a garden or crops? It would be useful to know how rainfall forecasts can help with irrigation planning.
weather365
Yes, definitely. Accumulated precipitation forecasts can help with irrigation planning by showing how much rain is expected over a specific period. Gardeners and farmers can use this information to adjust watering schedules and avoid unnecessary irrigation. It’s also helpful to consider soil type, crop needs, and rainfall intensity when making irrigation decisions.
Alexander Lewis
I used to confuse precipitation with accumulated precipitation. The examples make it much easier to understand that accumulation is the total amount over a specific period.
weather365
Exactly! It’s an easy distinction to miss. Precipitation describes what is falling from the atmosphere, while accumulated precipitation shows the total amount collected over a specific period. Glad the examples helped clarify it!
Riley Larson
Does accumulated precipitation include snow?
weather365
Yes. Accumulated precipitation can include rain, snow, sleet, and hail. However, snowfall may be reported separately as snow depth or snowfall accumulation, so it is important to check what a particular weather forecast measures.
Angelina Lindsey
Is 10 mm of rain a lot?
weather365
It depends on the timeframe. Ten millimeters spread over 24 hours may be relatively modest, while 10 mm falling within a short period can produce heavier rainfall and localized flooding, especially where drainage is poor.
Leave a comment
Your email address will not be published. Required fields are marked *